
LSB Industries Rebounds with Strong Operating Turnaround and Navigates Commodity Volatility
The company shifts from a loss-making year in 2024 to notable profitability in 2025, leveraging operational improvements amid challenging input cost environments.
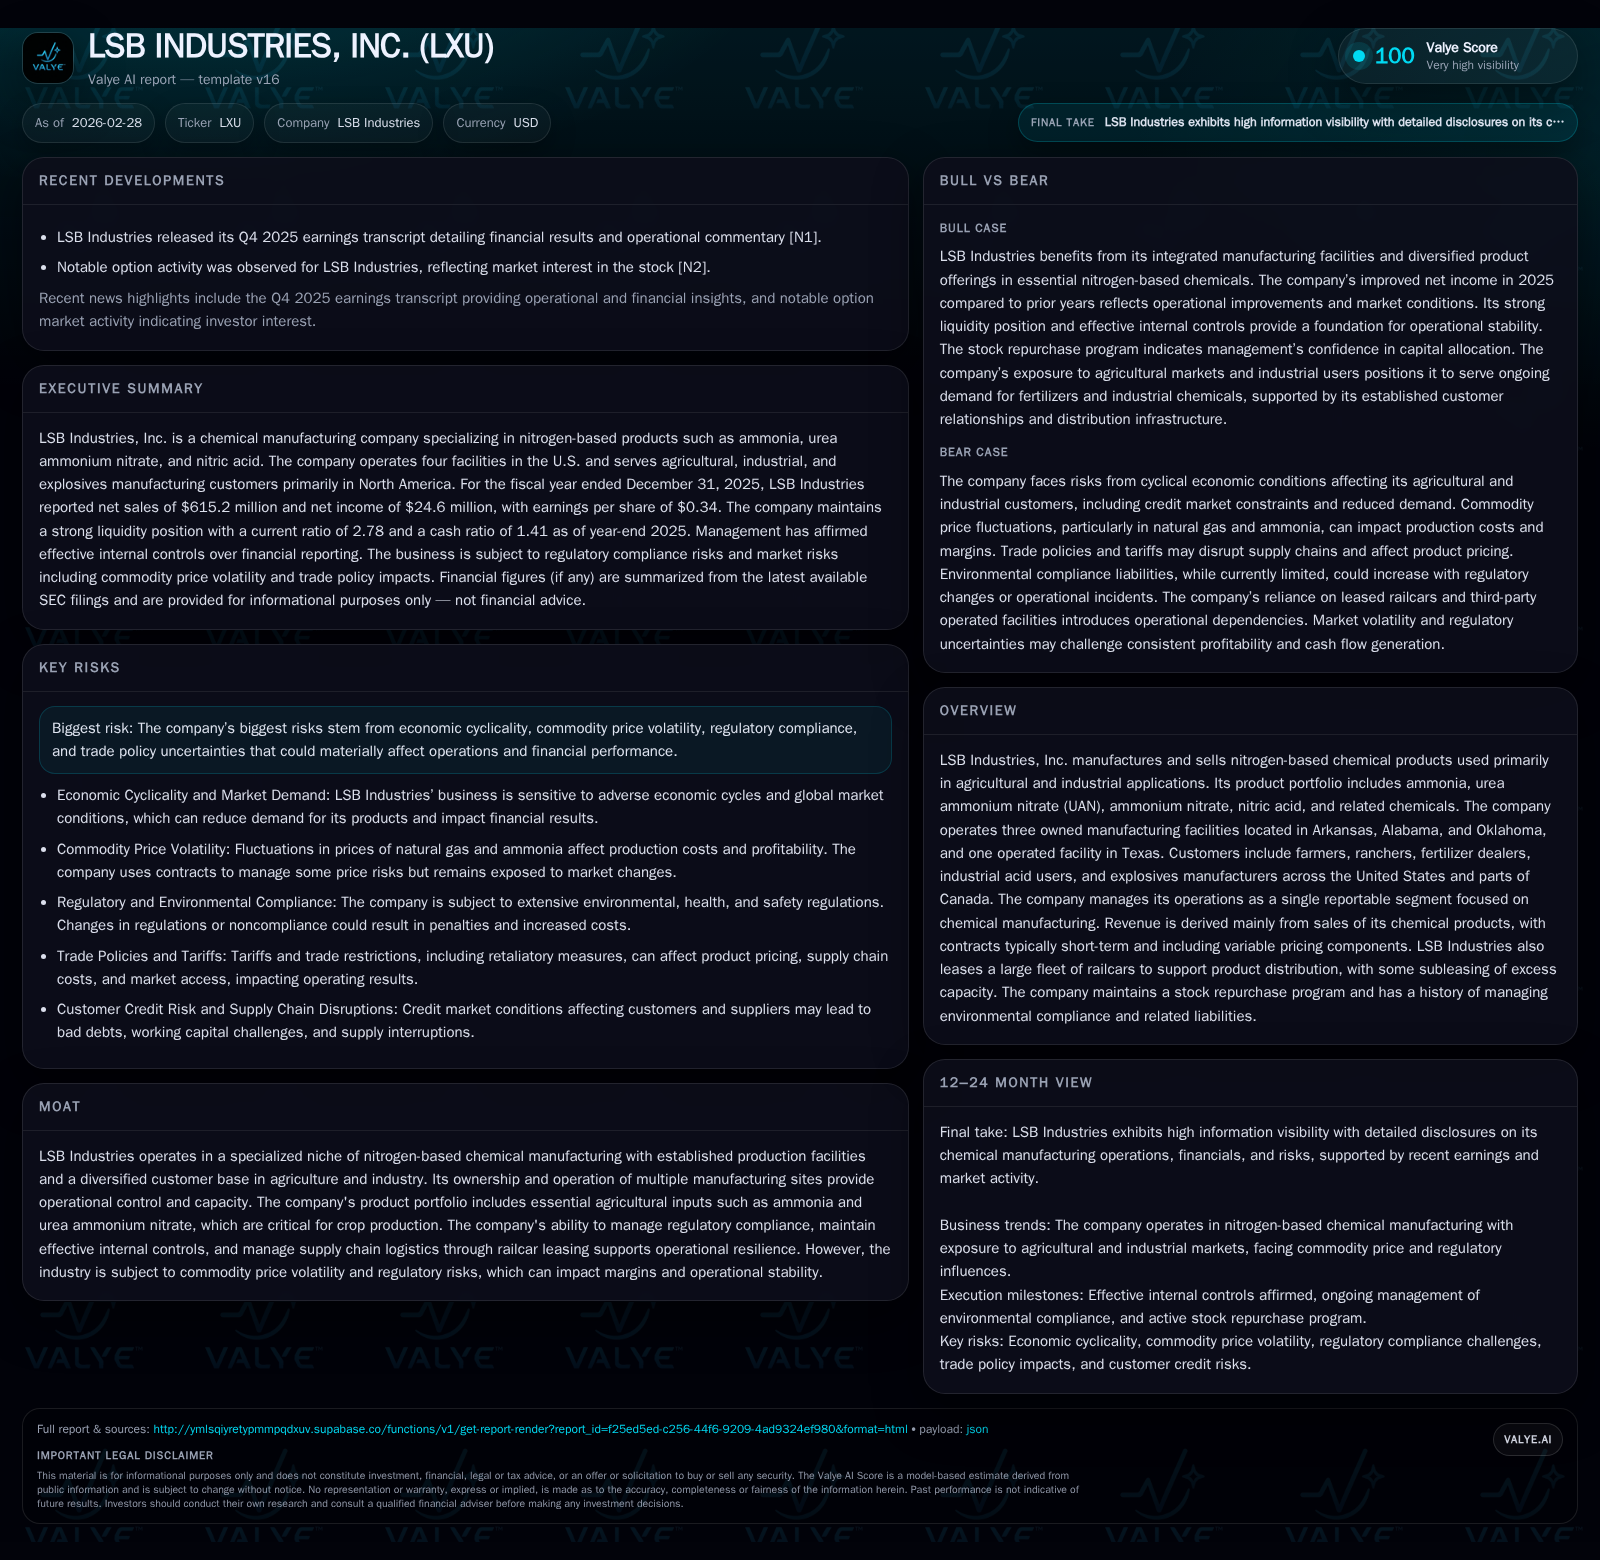
LSB Industries, a nitrogen-based chemical manufacturer integral to agriculture and industry, experienced a sharp financial turnaround in FY2025. Operating income swung from a negative $5.5 million in 2024 to a positive $57.3 million in 2025, driven by improved pricing dynamics and tighter cost controls despite exposure to volatile natural gas feedstock costs. While raw material price fluctuations and regulatory compliance remain key risks, the company’s capital allocation remains disciplined with moderate share buybacks and significant reinvestment in its facilities. Going forward, market cyclicality, regulatory shifts, and commodity input volatility are primary factors shaping growth prospects.
Financial Rebound: Decoding LSB’s Marked YoY Turnaround in Operating Results
LSB Industries delivered a remarkable financial turnaround in FY2025 following a challenging year in 2024. The company reversed an operating loss of $5.5 million recorded in FY2024 to achieve an operating income of $57.3 million in FY2025 — an over elevenfold increase [F1]. This shift was accompanied by net income moving from a loss of $19.4 million to a positive $24.6 million, underscoring improvements not only on the top line but across operational efficiencies.
Management attributed this swing primarily to more favorable ammonia product pricing driven by market conditions improving through late 2025, alongside cost discipline across manufacturing operations [N1]. Although revenue increased only modestly by about 4.2% compared to prior years’ levels, the margin expansion was notable considering persistent input price pressures.
Core Business Dynamics: Nitrogen Chemical Product Demand and Pricing Volatility
LSB’s core product suite centers on nitrogen-based chemicals including ammonia, urea ammonium nitrate (UAN), ammonium nitrate, and various acids essential for agricultural fertilizers and industrial applications such as explosives and acid uses [S1][N1]. These products serve crucial end markets like farming — especially grain production — which exhibit distinct seasonal cycles impacting demand volumes.
Sales contracts tend to be short-term with variable pricing elements sensitive to global commodity swings, notably natural gas prices affecting production costs and spot sales prices influenced by competing nitrogen sources [S1]. This creates recurring challenges in matching input cost spikes with timely product price adjustments, often compressing margins during periods of sharp feedstock inflation.
Raw Material Risks: Managing Natural Gas Price Fluctuations and Supply Constraints
Natural gas represents the principal raw material cost driver for LSB's nitrogen fertilizer production. Its price is highly volatile and subject to geopolitical events, domestic drilling activity shifts, weather disruptions, regulatory changes affecting hydraulic fracturing practices, and rising industrial demand — notably due to emergent sectors such as AI data centers consuming power reliant on natural gas [S1][S16][S22].
While LSB deploys forward contracts for portions of anticipated natural gas usage (e.g., fixed-volume purchase commitments covering early 2026 shipments at ~$4.39/MMBtu as of December 31, 2025), these coverages are limited relative to total needs [S20]. Consequently, sudden price surges risk increasing production costs beyond contractually pass-through able amounts given some sales lack explicit raw material cost passthrough clauses.
Furthermore, supply chain disruptions can directly lead to production halts or reduced capacity utilization; LSB acknowledges having suspended production historically under such constraints as recently as prior years [S1]. This lingering vulnerability forms a material risk factor affecting near-to-medium term operating stability.
Operational Footprint: Production Facilities’ Role in Capacity and Risk Management
LSB operates three wholly owned manufacturing facilities situated in Arkansas (El Dorado), Alabama (Cherokee), and Oklahoma (Pryor), along with one operated plant near Baytown, Texas managed for Covestro LLC [N1][S1]. This footprint provides some geographic diversification while allowing management direct control over key assets.
However, reliance on this limited number of sites concentrates operational risk; disruptions stemming from severe weather events, unplanned maintenance turnarounds which occur every two to three years per plant cycle guidelines, or safety incidents could materially curtail output capacity temporarily or longer term [S21]. Notably, regulatory permit renewals necessary for continued operations introduce further bottlenecks given potential delays or modifications that could impede facility availability [S16].
Assets are significant capital-intensive investments requiring ongoing reinvestment: PP&E net book value stood above $833 million at year-end 2025 underpinning substantial fixed operational leverage [F1][S23].
Capital Allocation Review: Stock Repurchases, Dividends, and Investment Trends
LSB maintains disciplined capital deployment practices aligned with operational cash flow realities. Although a sizable $150 million stock repurchase program was authorized by the board in May 2023, actual buybacks during FY2025 totaled only approximately $2.8 million at an average price of $9.15 per share—representing a cautious approach amid volatile external conditions [S5][F1][S18].
No dividends were declared or paid recently according to public filings indicating prioritization of reinvestment over shareholder yield distributions.
Capex expenditures remained elevated at roughly $77.5 million during FY2025—primarily directed towards plant upkeep including major maintenance turnarounds required for safe operation and compliance-driven equipment updates facilitating environmental permitting adherence [F1][S21]. This compares with capex nearer $92 million in FY2024 demonstrating moderate moderation tied potentially to postponed project timing amidst economic uncertainty.
Free cash flow generation remains positive albeit modest; operating cash flows at about $95.5 million less capital spending yields an estimated free cash flow of approximately $18.1 million signaling sufficient internal funding capability for organic maintenance plus selective returns [F1].
Balance Sheet Health: Debt Profile, Liquidity Positions, and Covenant Implications
At fiscal year-end 2025, LSB carried long-term debt principally composed of Senior Secured Notes totaling approximately $438.6 million due October 2028 with an interest rate fixed at around 6.25%—down from previous levels due to partial open market repurchases executed during the year totaling nearly $40 million amortizing outstanding debt balances [S6][S10].
No outstanding drawings existed on the revolving credit line as of December 31st providing flexibility; availability remained at about $44 million under a facility max around $75 million subject to borrowing base calculations—the facility matures alongside notes but can be accelerated under covenant triggers yet none were breached as of reporting date [S6][S14][S29].
Current ratio stands soundly at ~2.78 reflecting healthy short-term liquidity supported by roughly $19.5 million cash plus sizable current assets relative to liabilities underscoring ability to meet near-term obligations comfortably [F1].
However, covenants embedded within debt instruments restrict dividend payments beyond set limits without lender consent while limiting additional secured debt issuance—all designed to maintain creditor protections given significant leverage levels capping financial flexibility somewhat compared to less-indebted peers [S9][S29].
Future Outlook: Growth Headwinds, Regulatory Environment, and Market Opportunities
Looking forward, LSB faces mixed growth prospects shaped by both cyclical market pressures and evolving regulatory landscapes. The agricultural market remains inherently cyclical influenced by crop pricing dynamics impacting fertilizer demand volumes; weakening macroeconomic conditions may weigh negatively on volumes sold as customer spending tightens [N1][S22].
Simultaneously regulatory requirements tied to environmental safety—including revised Risk Management Program rules effective from 2027—and escalating compliance costs necessitate ongoing capital deployment into both technology upgrades and permit renewals posing incremental expense burdens restrictively shaping operating margins over time [S16][S24].
Commodity price volatility especially regarding natural gas will persist alongside competition from imported fertilizers whose pricing can depress domestic selling prices limiting margin recovery opportunities given input cost fluctuations outpacing sales contract adjustments partially constrained by variable price contracting terms common within this sector [N1][S22].
Emerging opportunities may arise via growing attention toward low-carbon fertilizer products or advanced formulations demanded by sustainable agriculture initiatives though these remain early-stage relative to existing product volumes so far outside disclosed company plans.
Key Financial Metrics Table: Revenue, Income, CFO, Capex Trends with YoY Growth
Historical performance (annual)
| FY | Net ($mm) | CFO ($mm) | OpInc ($mm) | Capex ($mm) | Net YoY |
|---|---|---|---|---|---|
| 2025 | 25 | 96 | 57 | 77 | +227.2% |
| 2024 | -19 | 87 | -6 | 92 | -169.3% |
| 2023 | 28 | 138 | 52 | 68 | -57.6% |
| 2022 | 66 | 346 | 308 | 46 |
Source: SEC companyfacts cache [F1].
Capital returns and efficiency (annual)
| FY | FCF ($mm) | ROE% |
|---|---|---|
| 2025 | 18 | 4.7 |
| 2024 | -6 | -3.9 |
| 2023 | 70 | 5.4 |
| 2022 | 300 | 12.8 |
Source: SEC companyfacts cache [F1]. Note: Revenue YoY comparable only where prior data available; Operating income shows drastic reversal highlighting recovery.
Investor Considerations: What To Watch Next In Quarterly Results And Cost Dynamics
Investors should closely monitor quarterly disclosures for indications regarding LSB’s ability to maintain margin improvements amidst raw material cost swings especially natural gas pricing trajectories where forward hedges presently cover limited volumes extending only into Q1–Q2 2026 [N1][S20]. Pay attention also to evolving sales mix trends across agricultural versus industrial segments which may offer margin variance.
Capital expenditure patterns relative to planned turnaround schedules could signal upcoming production availability shifts impacting output volumes while regulatory developments or permit renewal progress may indicate unforeseen operational interruptions or escalating compliance expenditure trends per recent federal updates around chemical safety standards initiated after incidents such as West Texas explosions remain pertinent contextual considerations [S16][S24].
Lastly share repurchase activity levels might provide clues into management’s confidence stance on internal cash flow strength versus prioritizing balance sheet deleveraging given sizable outstanding senior notes while dividend policy remains dormant.
This analysis reflects information publicly available through SEC filings including the company’s latest Form 10-K dated February 26th, 2026 as well as the recent earnings call transcripts dated February 26th reflecting results through fiscal year-end December 31st, 2025 ([F1], [N1], [S#]). It seeks neither investment advice nor recommendations but aims at a comprehensive view integrating financial metrics with operational contexts specifically tailored for professional audiences familiar with chemical manufacturing sector dynamics.
Disclaimer: This is research-only, informational analysis and not investment advice. It may include AI-generated interpretation and general industry context. Always verify important details using primary sources.

Comments