
La-Z-Boy’s Brand and Supply Chain Drive Flat Revenue and Margin Pressure in FY2025
In FY2025, La-Z-Boy grapples with stagnant revenue and tightening margins amid an evolving retail strategy and supply chain complexities.
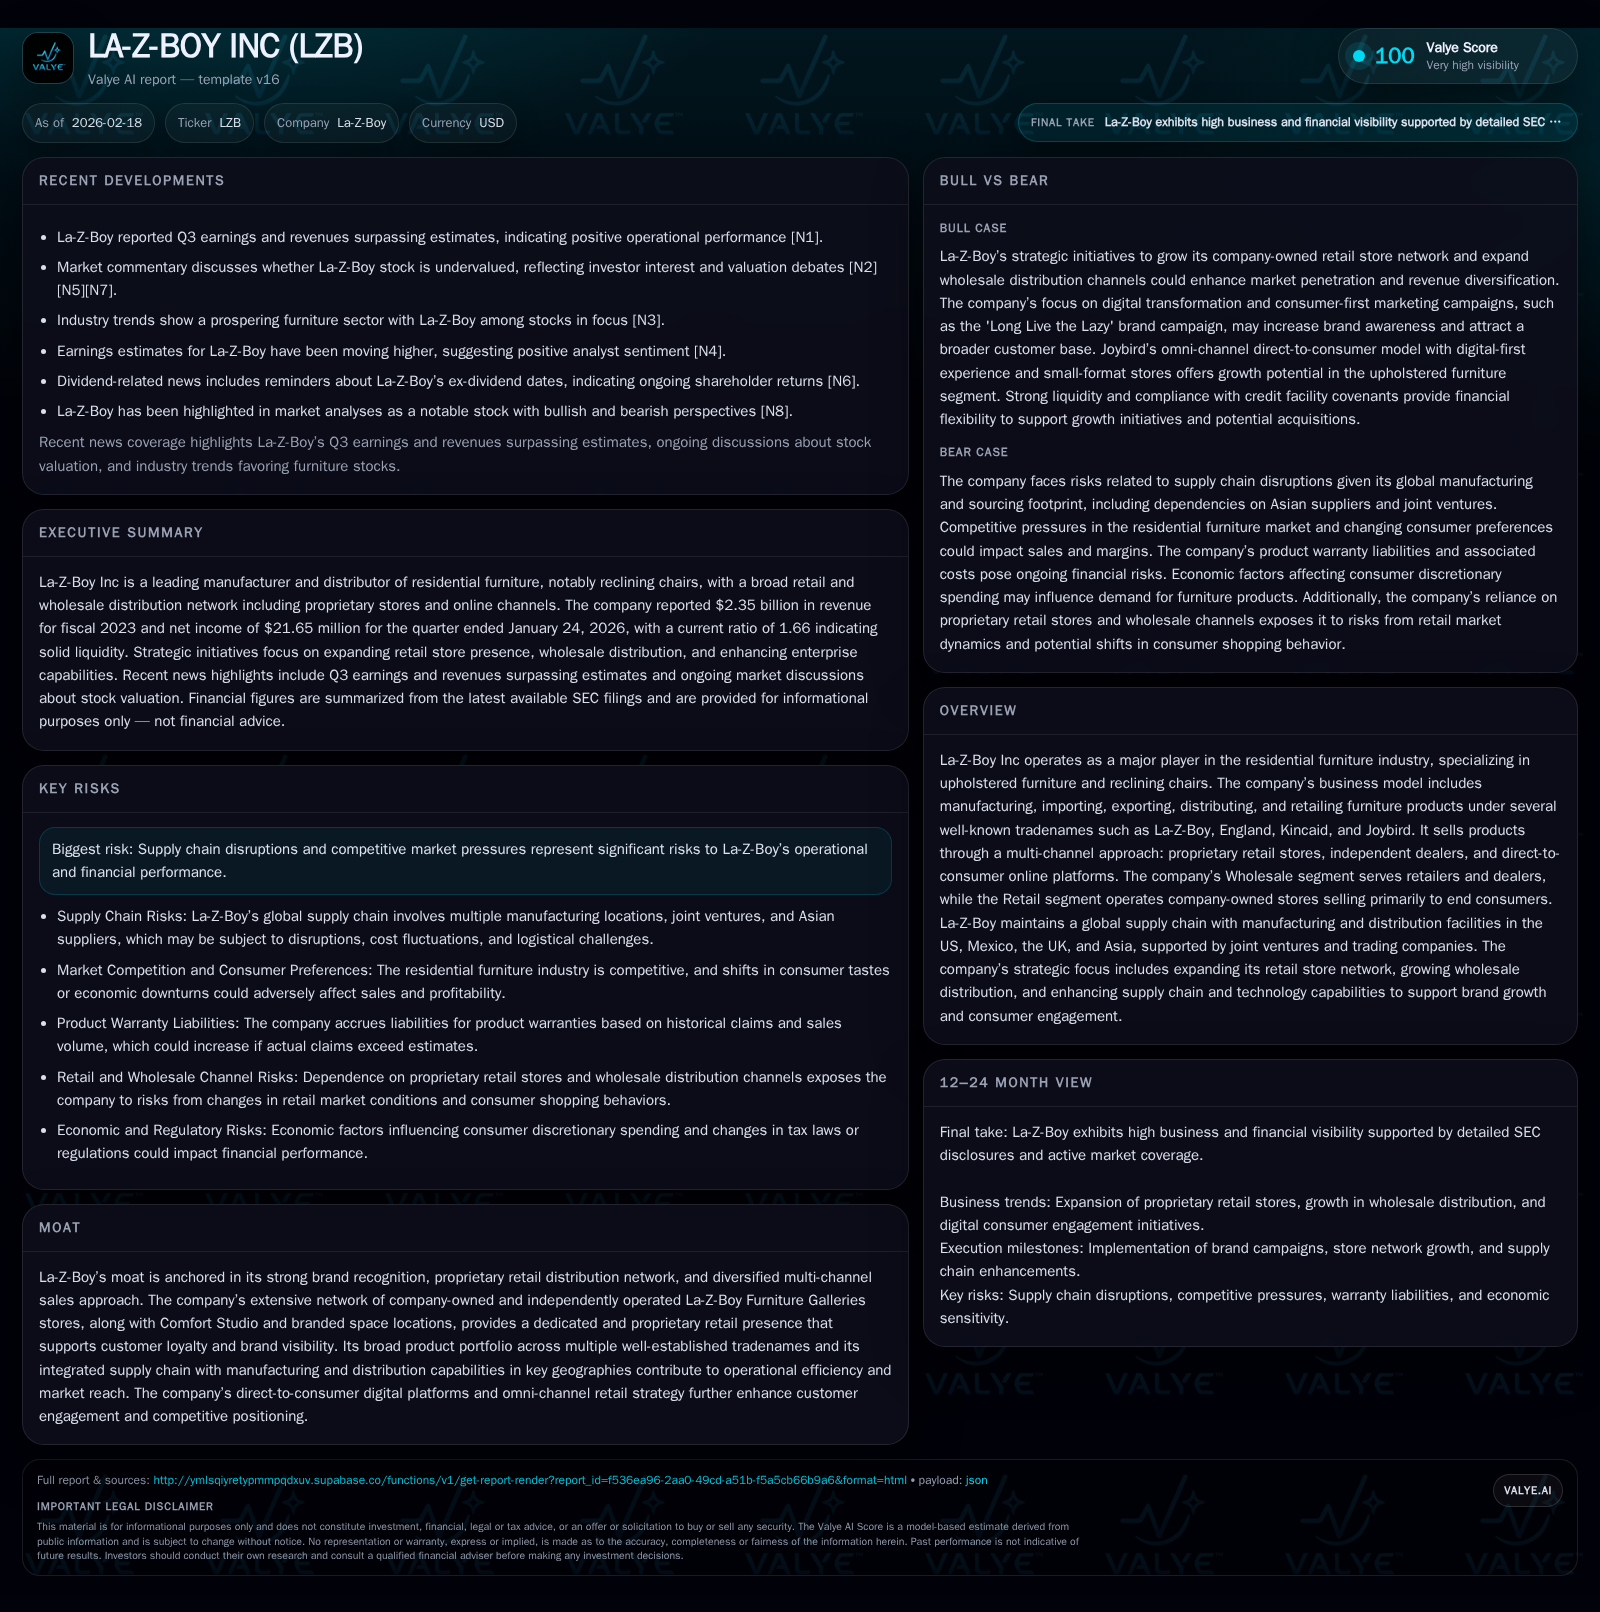
La-Z-Boy Inc maintained a steady revenue base in FY2025, with sales nearly flat year-over-year at approximately $2.36 billion [F1]. However, operating income declined by nearly 10% due to margin pressures linked to supply chain disruptions and competitive retail dynamics [F1]. The company’s multi-channel sales approach, including wholesale partnerships and proprietary retail stores, continues shaping its market presence but faces cost headwinds. Strategic emphasis on expanding the retail network and boosting e-commerce capabilities underpins growth prospects, although near-term margin volatility persists. Capital allocation remains disciplined with notable share repurchases alongside dividends, supported by a strong liquidity profile and amended credit facility improving financial flexibility [S4][S13][F1].
Iconic Brand Legacy: Historical Growth Drivers and Fiscal Year Trends
La-Z-Boy Inc has long established itself as a stalwart in residential upholstered furniture, leveraging strong brand equity primarily through its signature reclining chairs and diversified furniture offerings under well-known tradenames like England, Kincaid, and Joybird. Its multi-channel distribution model—combining company-operated stores (Retail) with a broad dealer network (Wholesale)—has historically fueled steady revenue growth.
In FY2025 ending April 26, 2025, the company's consolidated revenues hovered near $2.36 billion ($2,359 million), reflecting a marginal decline of 0.3% year-over-year from $2.37 billion in FY2024 [F1]. Despite the stable top line, operating income dipped substantially by 9.9%, from approximately $150.8 million down to $135.8 million, signaling profit pressures despite volume resilience [F1]. This contraction permeated net income performance as well, which slid 18.8% YoY to roughly $99.6 million from $122.6 million the prior year.
La-Z-Boy's product diversification across fabrics, leatherwear, mechanisms, cushions, padding along with casegoods sourced via imports is supported by an extensive manufacturing footprint spanning North America and Asia; this breadth enables its SKU assortment optimization yet also introduces cost variance vulnerability amid fluctuating raw material prices.
Historical performance (annual)
| FY | Rev ($bn) | Net ($mm) | CFO ($mm) | OpInc ($mm) | Rev YoY | Net YoY |
|---|---|---|---|---|---|---|
| 2025 | 100 | 187 | 136 | -18.8% | ||
| 2024 | 123 | 158 | 151 | -18.6% | ||
| 2023 | 2.3 | 151 | 205 | 211 | -0.3% | +0.4% |
| 2022 | 2.4 | 150 | 79 | 207 | +35.9% |
Note: Omitted columns lack sufficient annual XBRL coverage in the provided tags (need ≥2 annual points): Capex, Div. Source: SEC companyfacts cache [F1].
Capital returns and efficiency (annual)
| FY | Buybacks ($mm) | FCF ($mm) | ROE% |
|---|---|---|---|
| 2025 | 78 | 113 | 9.8 |
| 2024 | 53 | 105 | 12.2 |
| 2023 | 5 | 136 | 16.0 |
| 2022 | 91 | 2 | 18.5 |
Source: SEC companyfacts cache [F1].
The slight decline in revenue coupled with sharper profit declines reveals emerging territorial shifts—operational costs elevated by inflationary input pricing and intricate logistics are constraining margin expansion despite relatively static volume demand.
Dissecting FY2025 Financial Performance: Revenues, Margins, and Operating Income
Detailed examination of Q3 FY2026 results shows revenues modestly beating estimates while facing ongoing operating challenges rooted in leisure furniture segment competition intense in both brick-and-mortar and online channels [N1][N2][S2]. Operating income for the quarter was approximately $29.8 million amid tight gross margin conditions influenced by elevated freight rates and increased warranty liabilities [S2].
No significant one-time charges were noted; rather the pressure stemmed from recurring cost escalations partly offset by pricing actions implemented earlier in fiscal periods.
This operational dynamic underscores how competitive intensity particularly among direct-to-consumer brands targeting millennial demographics tempers industry-wide margin benchmarks.
Consumer Channels Under Review: Wholesale Versus Retail Segment Developments
La-Z-Boy's business segments illustrate differentiated performance patterns: Wholesale sales remain sizeable yet exhibit SKU pressure as dealers optimize assortments for profitability amid consumer discretionary trends; meanwhile, Retail operations expand through company-owned La-Z-Boy Furniture Galleries (205 locations) complemented by over 500 dedicated Comfort Studio spaces embedded within third-party retailers [S11][S16][N1].
The Retail segment benefits from more favorable unit economics due to direct pricing control but incurs higher fixed costs related to store operations and personnel.
Omni-channel initiatives including ecommerce platforms serve as key growth levers; Joybird's digital-first approach targets younger consumers with customizable offerings leveraging direct shipment models that improve inventory turnover metrics albeit requiring sustained marketing expenditure.
Channel margin variability reflects these structural nuances with wholesale margins generally narrower due to trade discounts contrasted against retail channel delivery efficiencies expected over time via SKU density optimization.
Supply Chain and Market Pressures: Impact on Margins and Operational Efficiency
La-Z-Boy’s integrated supply chain spans five major U.S.-based manufacturing locations supplemented by facilities in Mexico, the UK upholstery plant plus Asian joint ventures optimizing mix between domestic assembly and pure imports particularly for casegoods categories [S18]. Such a geographically dispersed model enhances speed-to-market capabilities but simultaneously exposes the company to tiered input cost pressures including freight surcharges driven by global container constraints.
Inventory turns have experienced modest deterioration owing partially to cautious stocking strategies aligned with macroeconomic uncertainty while warranty-related accruals have risen reflecting higher service costs predominantly within the Wholesale segment [S7][S8]. Warranty liabilities cover fabric/leather defects (1-3 years), cushions (up to five years), mechanisms/frames often guaranteed for life or provided under Joybird's limited lifetime warranty.
Inflationary cost factors combined with labor cost escalations further compress gross margins necessitating stringent operational efficiency programs.
Strategic Outlook: Expansion Initiatives and Product Innovation Plans
Management emphasizes enlarging its proprietary retail footprint—expansion of Furniture Galleries and Comfort Studio locations aligns with strategic intent to enhance brand presence directly at consumer touchpoints while improving customer engagement through style consultancy services [N1][N6].
Digital enhancements invest heavily in user experience improvements on websites la-z-boy.com and joybird.com aiming to grow direct-to-consumer penetration which management views as pivotal for sustaining competitiveness against digitally native disruptors.
New product introductions under premium tradenames such as Joybird target younger demographics favoring stylish customization options delivered efficiently via omni-channel ordering portals bolstered by digital marketing campaigns optimized on social media platforms.
While these initiatives promise incremental revenue upside they also elevate fixed selling expenses until scale economies normalize margins.
Capital Structure and Shareholder Returns: Credit Agreements, Dividends, and Repurchases
A critical development underpinning financial flexibility was the July 1, 2025 amendment to La-Z-Boy’s revolving credit facility originally entered Oct 15, 2021: maturity extended from Oct 15, 2026 to July 1, 2030; accordion capacity uplifted from $100M to $125M; SOFR credit spread adjustments removed; fixed charge coverage ratio covenant lowered facilitating improved covenant headroom [S4][S8].
As of January 24, 2026 the credit facility reported zero outstanding borrowings underscoring robust liquidity with cash & equivalents at a healthy $306 million paired with a current ratio of roughly 1.66 indicating short-term solvency strength [F1][S8].
FY2025 capital allocation reflected disciplined balance sheet stewardship combining sizable share repurchases totaling near $77.9 million alongside dividend payments approximating $9 million maintaining payout continuity consistent with long-term policy emphasizing shareholder returns balanced against investment needs [F1][S13].
Return metrics indicate approximate ROE around 9.8%, consistent with sector midrange benchmarks given recent profit dynamics while operating cash flow increased significantly (+18%) supporting capex outlays over $74 million primarily directed toward facility upgrades and retail expansion projects that rose nearly +39% versus prior year levels offering organic growth capacity enhancement.
Key Milestones Ahead: What Investors Should Monitor Next
Post Q3 FY2026 earnings release witnesses trending themes underscored by slight stock price technical weakness attributed partly to broader market volatility rather than fundamental shifts per analysis offered on Nasdaq platforms highlighting cross below moving averages as critical short-term indicators [N3][N4].
Investors should track progression on margin recovery initiatives including raw material procurement efficiencies; supply chain normalization timelines reflecting easing logistics bottlenecks; cadence of new store openings within Furniture Galleries network plus Comfort Studio rollouts—the latter instrumental in supporting omni-channel sales synergy netting improved SKU throughput ratios.
Additionally monitoring DTC ecommerce growth rates vis-à-vis marketing ROI will signal sustainability of digital investments alongside product innovation reception especially within Joybird’s portfolio targeting lifestyle trends.
Financial covenant compliance remains sound but watch for any leverage fluctuations given possible M&A activity or capex acceleration.
This analysis synthesizes regulatory filings, earnings transcripts, news reports, and historical financial data focusing exclusively on documented facts without offering investment advice or price forecasts.
Disclaimer: This is research-only, informational analysis and not investment advice. It may include AI-generated interpretation and general industry context. Always verify important details using primary sources.
Comments