
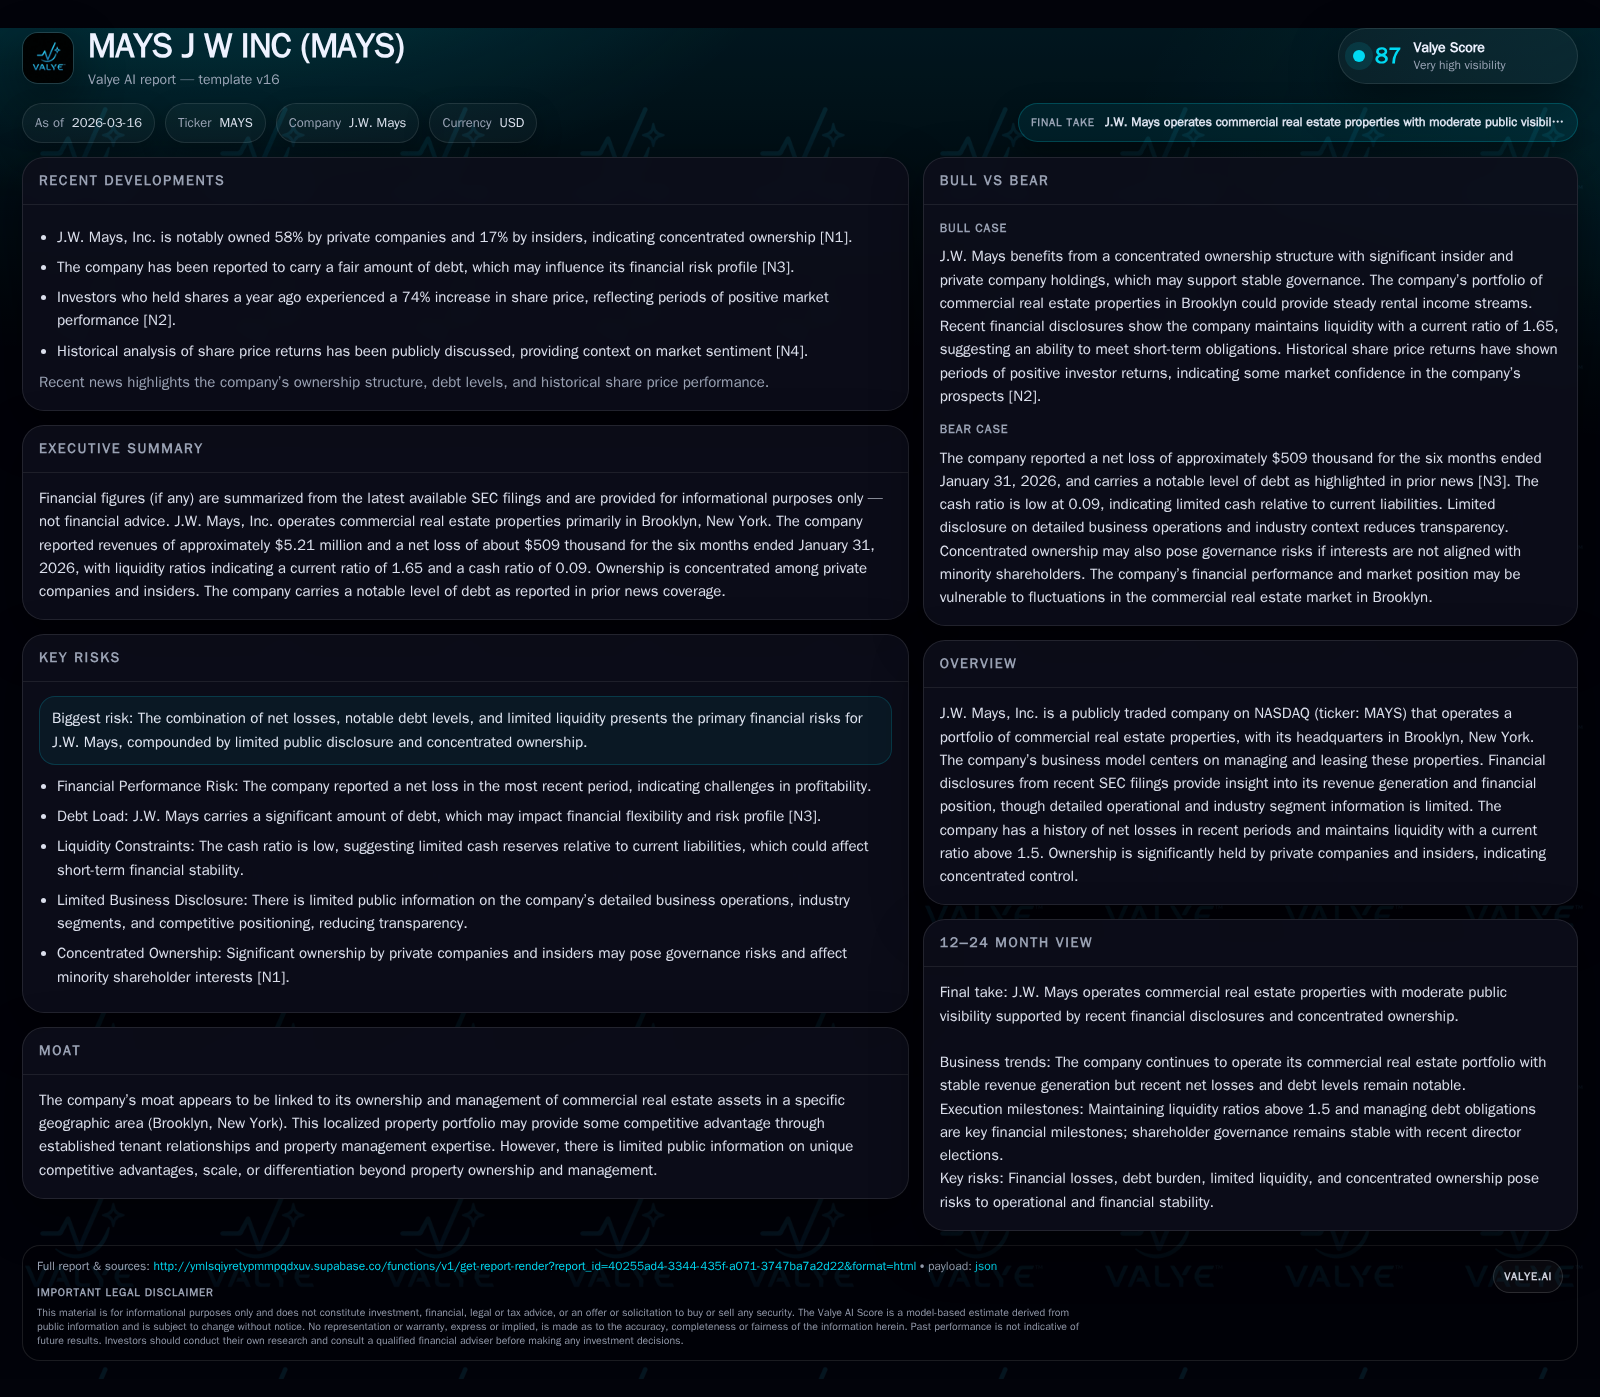
J.W. Mays Inc.: Revenue Growth and Debt Management Shape Its Path Forward
J.W. Mays preserves steady topline growth and bolsters operating cash flow despite ongoing net losses and concentrated ownership.
J.W. Mays, a Brooklyn-based commercial real estate operator, has demonstrated stable revenue expansion over the past four years, supported by its localized urban property portfolio. Operating income remains negative but showed a notable year-over-year improvement in FY2025, alongside significant gains in operating cash flow, which now comfortably exceeds capital expenditures. The company maintains a current ratio above 1.5, signaling adequate liquidity amid debt obligations, but continued net losses keep returns on equity marginally negative. Concentrated insider and private company ownership shapes governance and capital allocation decisions. Investors should monitor future debt management efforts and operational efficiencies as key factors influencing prospects.
Consistent Top-Line Revenue Supported by Localized Property Holdings
J.W. Mays, Inc., headquartered at Nine Bond Street in Brooklyn, NY, operates a focused portfolio of commercial real estate assets concentrated within this urban geography [S6]. This focus has underpinned relatively steady revenue generation from leasing activities over the last four fiscal years. According to company filings, total revenue increased from approximately $21.40 million in FY2022 to $22.47 million in FY2025—a compounded trend indicating modest top-line stability with a 4.1% increase between FY2024 and FY2025 alone [F1]. This steady revenue base reflects tenant retention and leasing fundamentals typical of established Brooklyn urban commercial nodes.
Historical performance (annual)
| FY | Rev ($mm) | Net ($) | CFO ($mm) | OpInc ($) | Rev YoY | Net YoY |
|---|---|---|---|---|---|---|
| 2025 | 22 | -136240 | 3 | -154332 | +4.1% | +66.5% |
| 2024 | 22 | -406568 | 1 | -620105 | -4.4% | -390.1% |
| 2023 | 23 | -82964 | 2 | 223667 | +5.5% | +88.4% |
| 2022 | 21 | -712371 | 2 | -657007 |
Source: SEC companyfacts cache [F1].
Capital returns and efficiency (annual)
| FY | FCF ($) | ROE% |
|---|---|---|
| 2025 | 128348 | -0.3 |
| 2024 | -1049411 | -0.8 |
| 2023 | 1175603 | -0.2 |
| 2022 | -44269 | -1.3 |
Source: SEC companyfacts cache [F1].
This slight fluctuation year-to-year is consistent with localized CRE market cyclicality but overall suggests resilience in J.W. Mays’ property management and leasing operations amidst a competitive Brooklyn environment.
Operational Performance: From Operating Income Volatility to Recent Improvements
While revenues have been generally stable, operating income figures have been volatile yet show a downtrend in operating losses in the most recent fiscal period [F1]. The company recorded an operating loss of $154K in FY2025 compared with a loss of $620K in FY2024—a significant 75% improvement despite remaining negative overall.
This performance suggests operational efficiencies or cost containment measures taking effect within the property management segment; given the nature of commercial leasing businesses, fixed costs such as property taxes and maintenance weigh heavily on margins but improved lease administration or tenant mix can enhance operational leverage.
| Fiscal Year | OpInc (USD) | YoY % |
|---|---|---|
| FY2022 | -657,007 | |
| FY2023 | 223,667 | |
| FY2024 | -620,105 | |
| FY2025 | -154,332 | 75.1% |
Net Income Evolution and Persisting Profitability Headwinds
Despite improvements at the operating level, net losses have persisted though at progressively smaller scales [F1]. In FY2025, net income stood at -$136K compared to a -$407K loss the prior year—a marked reduction representing a better financial position albeit still unprofitable.
Such net results derive not only from operating challenges but also interest expense aligned with the company's debt profile. Return on equity remains negative at approximately -0.3%, confirming that equity holders are yet to see positive returns amid these net loss periods.
| Fiscal Year | Net Income (USD) | YoY % |
|---|---|---|
| FY2022 | -712,371 | |
| FY2023 | -82,964 | |
| FY2024 | -406,568 | |
| FY2025 | -136,240 | 66.5% |
Robust Operating Cash Flow and Its Role in Sustaining Operations
A pivotal highlight for J.W. Mays is its robust operating cash flow (CFO), which grew significantly to $2.52 million in FY2025 from $1.43 million in FY2024—a rise of over 75%. This progression indicates effective rent collections and operational efficiencies critical to cash generation even when profits are elusive [F1].
The company's capacity to generate positive cash flow sustains daily operations and supports liquidity despite recurring accounting losses.
Capital Expenditures Reflect Maintenance and Strategic Upkeep Priorities
Capital expenditure outlays totaled approximately $2.39 million during FY2025—a small decrease from $2.48 million the prior year (-3.7%) [F1]. These expenditures likely correspond to capital maintenance projects funded to uphold property conditions essential for tenant satisfaction and asset value preservation within an aging urban portfolio.
The modest reduction signals disciplined spend management within an environment where extensive capex can strain cash flows.
Liquidity Position and Debt Profile: Navigating Financial Risks
Liquidity metrics as derived from SEC disclosures reveal a current ratio around 1.65 (calculated as current assets of about $8.13 million against liabilities of roughly $4.93 million as of April 30, 2020), illustrating adequate short-term coverage against obligations [F1][S9][S10][S11][S15][S19][S20].
Nonetheless, the company maintains notable debt balances highlighted throughout recent filings which pose continuing financial risk considerations [S4][S5][S7][S8]. Managing this leverage effectively remains critical as risk factors related to indebtedness and liquidity constraints were reiterated with no material change reported across annual and quarterly reports.
Ownership Structure and Its Influence on Corporate Governance
J.W. Mays exhibits ownership concentration primarily among insiders and private companies according to SEC filings [S1][S14], which can impact corporate governance dynamics including board decision-making autonomy observed during recent shareholder meetings [S14]. This structure may streamline policy execution but also restrict broad public shareholder influence.
Insider engagement extends beyond ownership into consultant roles evidencing deep executive involvement in financial oversight [S15].
Future Outlook: Key Risks and Opportunities from Company Disclosures
The company’s risk disclosures confirm debt servicing pressures combined with market exposure inherent to Brooklyn’s CRE sector remain principal concerns [S4][S5][S7][S8]. These include legal proceedings referenced briefly without material impact presently [S4], underlying litigation risks typical for proprietors in urban real estate portfolios.
No significant shifts were noted recently regarding these risks; as such vigilant monitoring of debt refinancing pathways alongside market demand trends constitutes prudent watch points for stakeholders given prevailing economic uncertainties in CRE markets.
Capital Allocation: Dividends, Buybacks, and Return on Equity
Dividend payments or share repurchase programs appear sparse or absent based on reported capital allocation data [F1][S14][S17], consistent with the company prioritizing liquidity preservation amid net losses and leverage management challenges.
The low or negative ROE further supports a restrained return of capital strategy while focusing resources on operational stabilization rather than distribution enhancements.
This analysis relies exclusively on public SEC filed data as of March 16, 2026 plus standard CRE operational context; all forward-looking statements should be regarded as interpretive analysis rather than company guidance or investment advice.
Disclaimer: This is research-only, informational analysis and not investment advice. It may include AI-generated interpretation and general industry context. Always verify important details using primary sources.
Comments