
Medpace Holdings Strengthens Clinical Trial Execution with Q1 Acceleration and Global Reach
Medpace’s robust Q1 2026 results underscore its disciplined CRO model and expansive global platform amid growing biopharma outsourcing demand.
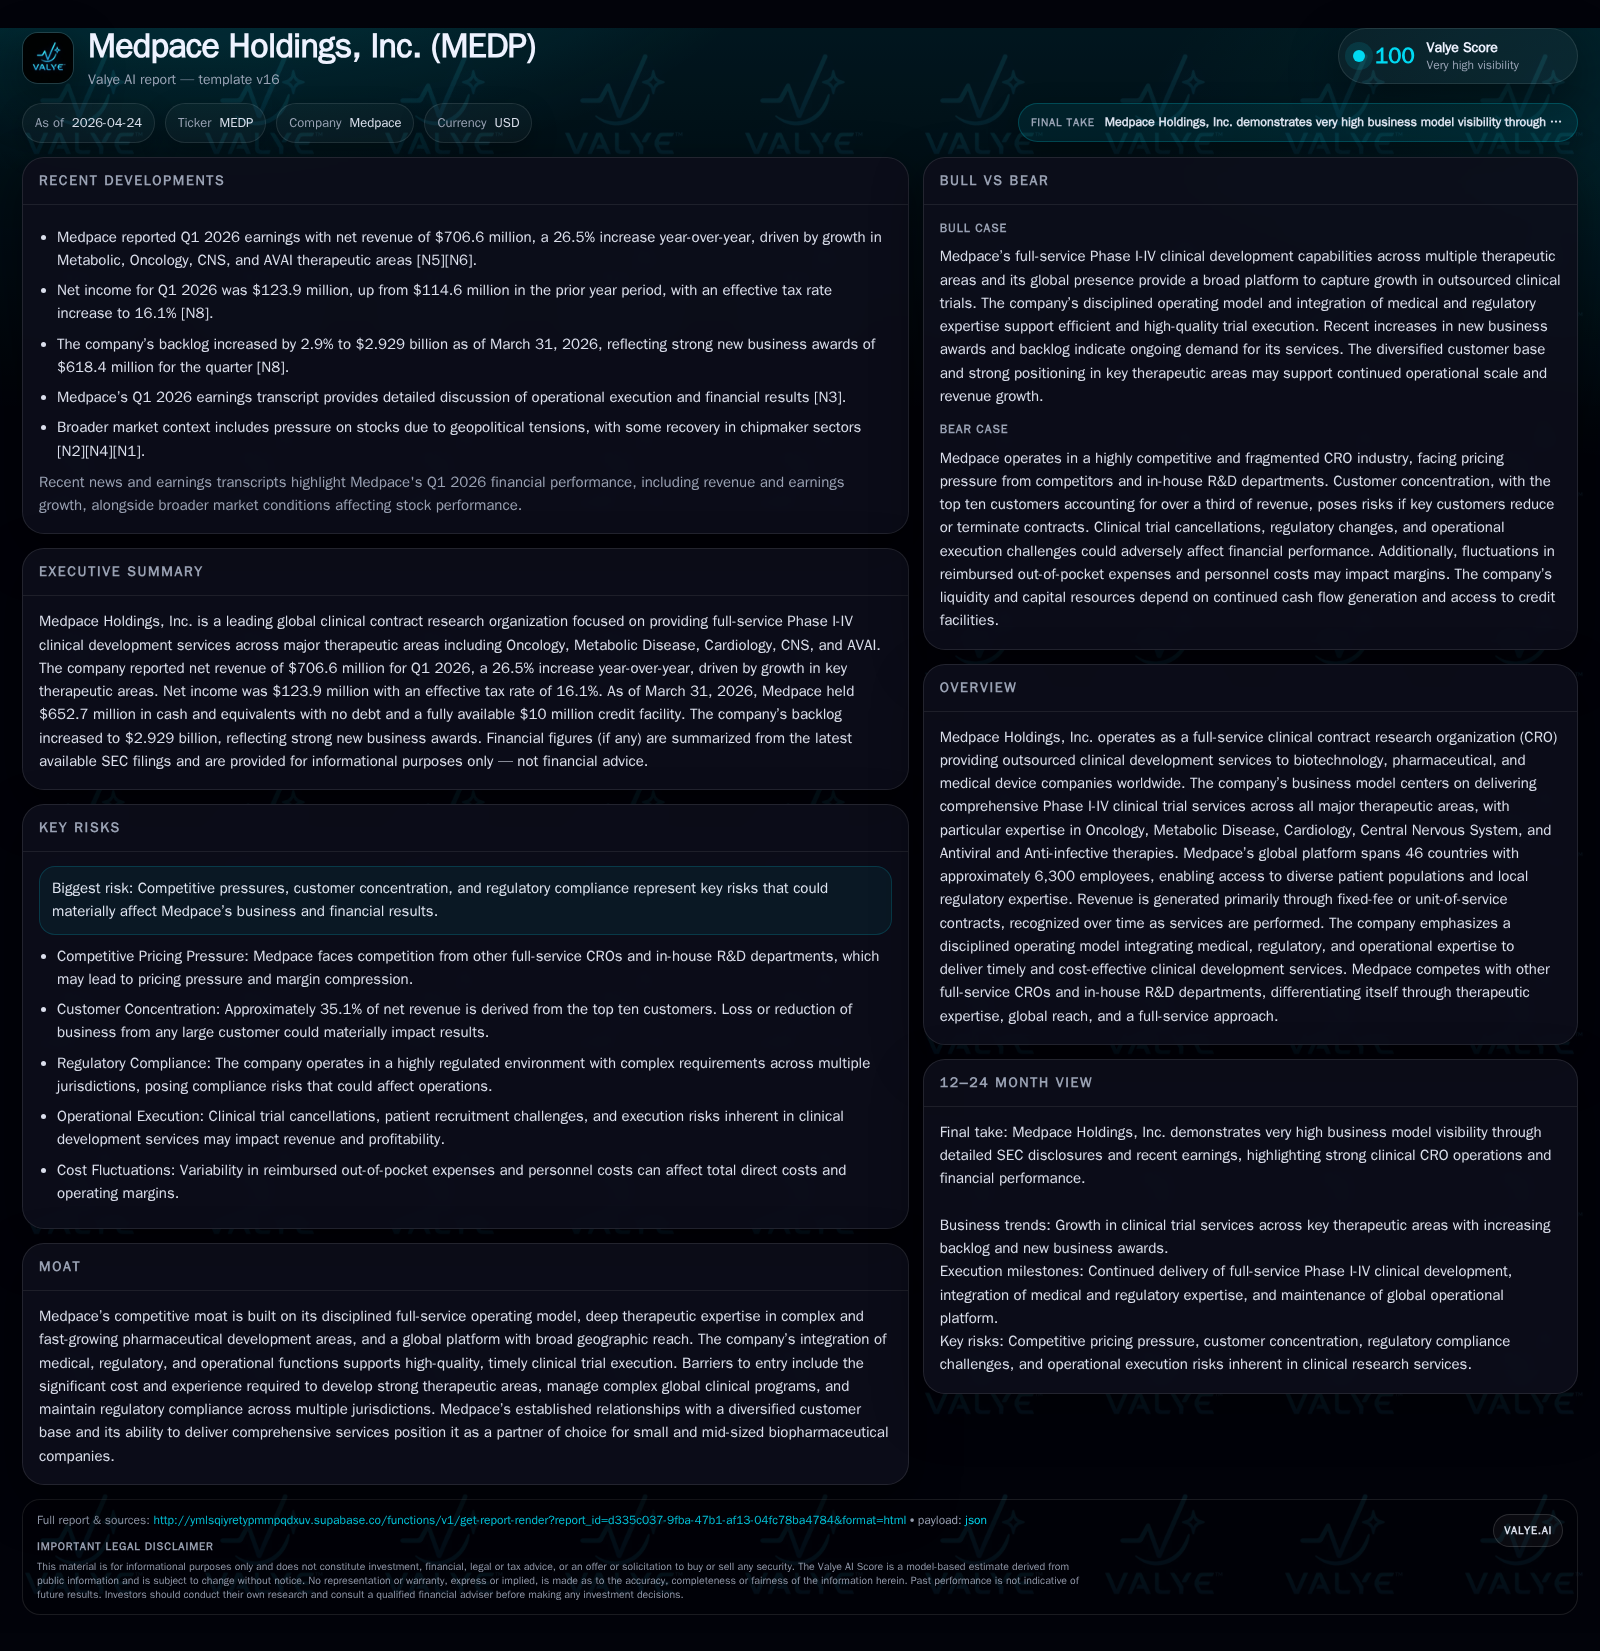
Medpace Holdings posted a 26.5% revenue increase in Q1 2026, driven by core therapeutic areas including Oncology and Metabolic diseases. The company’s backlog expanded modestly, supporting sustained near-term revenue growth visibility. Medpace’s full-service clinical development approach, bolstered by integrated medical expertise and proprietary technology, continues to differentiate it within a competitive, fragmented CRO industry. Despite margin pressures tied to reimbursed out-of-pocket costs and patient recruitment challenges, operating leverage and strong cash flow generation remain evident. Investors should monitor backlog conversion trends, contract awards, and potential impacts from regulatory or geopolitical risks going forward.
Q1 2026 Operating Update: Near-Term Performance Highlights Medpace Holdings reported strong first-quarter results for the period ended March 31, 2026. Total revenues increased by 26.5% year-over-year to $706.6 million from $558.6 million in the prior-year comparable period [S2], driven primarily by growth in the Metabolic Disease, Oncology, Central Nervous System (CNS), and Antiviral and Anti-infective (AVAI) therapeutic segments [S20]. This top-line acceleration aligns with increased trial activity across these high-demand areas. The company disclosed net new business awards of $618.4 million for Q1 2026 versus $500.0 million a year earlier—a significant lift indicating ongoing contract momentum [S7]. Backlog rose modestly by 2.9% year-over-year to $2.93 billion as of March 31, 2026 (from $2.85 billion on March 31, 2025) with roughly $1.93–$1.95 billion due to convert into revenues over the forthcoming twelve months [S10]. This pipeline stability reinforces near-term revenue visibility despite inherent volatility from project cancellations or timing shifts inherent in clinical research outsourcing contracts. Revenue recognition continues under a model where most client contracts are single performance obligations fulfilled over time as services are rendered—typically blending fixed-fee components collected upfront alongside milestone or billing schedule-based collections later in the project lifecycle [S2]. This structure underscores that reported revenue reflects earned service delivery rather than mere billings or cash receipts. Total direct costs for the quarter ballooned by approximately 34%, reaching $510 million due principally to surging reimbursed out-of-pocket expenses (+54%) linked to escalating site activation costs and patient-related expenditures across expanding trial volumes; personnel-related direct costs also rose by roughly $20 million reflecting necessary staffing for higher activity levels [S20]. However, careful expense management drove a notable 17% decline in selling, general & administrative expenses owing largely to lower stock-based compensation while offsetting incremental wage inflation [S22]. Operating income expanded almost 25% to $141.5 million supported by operating leverage despite higher variable costs associated with trial execution complexity and out-of-pocket spend fluctuations typical in CRO operations [S20]. Miscellaneous income swung favorably attributable partly to foreign exchange gains within intercompany revaluations abroad—a relevant factor given Medpace’s multinational footprint spanning Europe and Asia Pacific regions [S22]. ## Business Model and Integrated Clinical Development Services Medpace operates as a leading full-service Contract Research Organization exclusively serving biotechnology, pharmaceutical and medical device clients globally through outsourced clinical development phases I through IV [S1]. The company’s business model centers on integrating medical advisory services with regulatory insight alongside operational execution under one platform leveraging proprietary systems such as ClinTrak—its internal information management system facilitating real-time trial monitoring aligned with standard operating procedures (SOPs) ensuring quality control consistency across geographies [S1,S2]. Revenue streams arise via individually negotiated contracts priced on fixed-fee or unit-of-service bases that incorporate third-party ancillary costs reimbursable by customers; initial fees are often collected upfront with remaining payments tied to milestones reflecting service delivery progress measured predominantly using input methods such as cost-to-cost realization principles [S2,S9]. Consequently, revenue fluctuations track changes in new study starts but also depend heavily on study duration complexities typical of biopharma R&D cycles. Medpace’s medical department offers strategic protocol design support through therapeutic leads who align clinical trial designs with scientific goals while providing ongoing medical monitoring amplified by interaction with regulatory bodies worldwide—a vital value-add given increasingly complex multi-jurisdictional approvals processes across its footprint spanning approximately 46 countries . Clinical trial managers coordinate study execution leveraging ClinTrak metrics reinforcing accountability and timely adjustments. Distinct units focus on feasibility analysis drawing from extensive datasets to optimize country-site selection sensitive to patient demographics availability; start-up teams handle regulatory submissions including IRB/ethics approvals paired with legal/budget negotiation specialists addressing contractual complexities at investigator sites; patient recruitment teams apply tailored strategies addressing enrollment barriers which remain one of the highest failure risks in successful clinical trial delivery within CROs facing intensifying competition for eligible participants globally [S1,S2]. This end-to-end service integration creates substantial switching costs since moving clinical development programs away midstream would entail significant operational risk exposure for sponsors dependent upon specialized therapeutic knowledge combined with local regulatory expertise available only through entrenched provider relationships. ## Industry Positioning and Competitive Moat Medpace competes within the fragmented yet rapidly growing CRO sector that serves an increasingly outsourced-biased pharmaceutical R&D environment driven by biopharma companies seeking efficiency gains amid tight budgets and complex trial designs focused on novel therapies particularly in oncology and CNS disorders . The company maintains competitive advantages through its disciplined full-service model encompassing all clinical phases alongside deep therapeutic area expertise deployed globally across an extensive geographical footprint consisting of more than 6,300 employees in 46 countries as of end Q1 2026—an enabler of access to diverse patient populations critical for accelerated enrollment timelines while meeting regional regulatory nuances with local subject matter experts well-versed in country-specific operational hurdles . High technical barriers deter new entrants given the steep investments needed to build infrastructure capable of multi-phase clinical trials combined with broad regulatory compliance frameworks spanning FDA rules plus EMA guidelines among others; additionally operational scalability demands cutting-edge IT systems like ClinTrak integrated seamlessly into SOPs facilitating real-time monitoring mitigating common trial delays caused by data lag or operational inefficiencies common elsewhere . Unlike larger CRO megavendors competing principally on scale alone who may fragment services across multiple silos or subcontractors potentially creating coordination inefficiencies or quality variability risks among sponsors seeking comprehensive turnkey solutions particularly smaller-to-mid sized biopharma firms valuing predictable high-quality execution aligned well with Medpace’s positioning as “partner of choice” within these segments reflecting approximately 82% exposure per latest annual filing aligned toward small biopharmaceutical customers whose outsized reliance on trusted CRO partnerships elevates switching resistance dynamics . Pricing power appears resilient yet tempered by industry-wide pricing pressures stemming from intensified competition especially among dominant global CRO conglomerates forcing ongoing operational efficiency improvements key to margin maintenance emphasizing Medpace’s investment in process discipline and cost controls.[S4,S12] ## Growth Drivers and Margin Leverage Opportunities Medpace’s growth thesis hinges on several structural tailwinds shaping clinical development markets: first is stable-to-increasing pharmaceutical R&D outsourcing spend benefiting smaller biotech innovators that lack internal large-scale infrastructure necessitating reliance on external CRO providers offering full development suites encompassing complex protocols within target niches like oncology-CNS-AVAI where high unmet need sustains drug discovery momentum; second is geographic expansion into emerging marketplaces augmenting patient recruitment diversity while capitalizing on favorable cost structures found outside traditional US-EU hubs enabling competitive pricing advantages; third is technology & methodology enhancements driving optimized trial feasibility assessments supporting accelerated site initiation reducing lag times between contract awards and study commencement maximizing backlog conversion rates [N1,S7,N2]. A disciplined capex regime trending lower as percentage of revenues coupled with high free cash flow generation underpins reinvestment capacity without undue financial strain sustaining organic growth initiatives alongside selective bolt-on acquisitions as flagged historically.[F1,S5] ## Challenges and Industry Risks to Monitor Key risk vectors articulated comprehensively stem from contract termination possibilities inherent given most agreements allow cancellations typically upon 30 days’ notice exposing Medpace materially if high-value projects prematurely cease impacting backlog conversion trajectory thus requiring agile project pipeline management[S4,S9]. Patient recruitment remains another critical bottleneck prone to delays especially amidst competitive patient pools for specialized indications threatening milestone timing reliability adding uncertainty around flow-through revenue recognition critical for forecasting accuracy[S25,S26]. Regulatory compliance complexity spanning varied international jurisdictions—the need for stringent adherence to FDA GCP standards plus GDPR-like privacy regimes globally—adds operational layers where missteps could trigger sanctions or reputational damage—amplified further given global multi-site presence requiring robust oversight mechanisms[S25,S26]. Additionally customer concentration risk remains material despite diversified base given roughly one-third revenues derive from top ten clients implying dependency vulnerabilities should any major sponsor reduce or terminate engagements reflected explicitly in risk disclosures[S12,S23]. Technology adoption risks centered around adequate human oversight surrounding artificial intelligence platforms being progressively incorporated into internal data processing systems represent evolving challenges impacting operational reliability if not vigilantly managed[S4]. Geopolitical uncertainties or pandemic resurgence could disrupt cross-border clinical activities delaying site activations adding exogenous operational hurdles specific to global supply chain dependencies[S4,N1]. ## Financial Overview Supporting Operational Momentum Medpace's financial profile entering Q1 reflects solid health aligned with operational uplift evidenced by:
- Revenue growth of +26.5% YoY yielding $706.6 million in Q1 ‘26 boosted primarily by key therapeutic expansions[S20]
- Operating income advancing nearly +25% year-over-year reaching approx. $141.5 million reflecting effective cost containment amidst rising volumes[S20]
- Net income totaled approximately $123.9 million marking steady profitability gains despite higher tax provisions (+$20 million compared Y-o-Y) attributable mainly to lower excess tax benefits recognized from share compensation schemes[S20,S13]
- Direct costs increases driven mainly by personnel related labor expenses (+$20M) supporting scale-up alongside pronounced jump (~54%) in reimbursed out-of-pocket spending linked closely to site activations/patient enrollment[S20]
- SG&A reduced notably (-17%) principally because of stock option compensation expense decrease offset marginally by increased payroll excluding stock comp indicating prudently managed overheads[S22]
- Capital expenditures declined slightly compared both sequentially and YoY underscoring efficient asset deployment strategy maintaining under ~1% of revenues supporting IT/infrastructure[S8,F1]
- Cash & equivalents surged surpassing $652 million at quarter end confirming robust liquidity buffer complemented by zero outstanding debt reinforcing conservative leverage stance[S5,S6,F1]
- Operating cash flow generation robust at roughly $152 million up sharply over prior year underpinning capacity for organic investment plus modest share repurchases absent during recent quarter though ample repurchase authorization remains available for opportunistic capital returns[S11,F1] ### Historical Financial Overview: Revenue, Operating Income, Net Income, CFO & Capex Trends (2019-2025)
Historical performance (annual) | FY | Net ($mm) | CFO ($mm) | OpInc ($mm) | Capex ($mm) | Net YoY |
| --- | :---: | :---: | :---: | :---: | :---: | | 2025 | 451 | 713 | 535 | 31 | +11.6% | | 2024 | 404 | 609 | 447 | 37 | +43.0% | | 2023 | 283 | 433 | 337 | 37 | +15.3% |
| 2022 | 245 | 388 | 279 | 37 | | Source: SEC companyfacts cache [F1]. ### Capital returns and efficiency (annual) | FY | Buybacks ($mm) | FCF ($mm) | ROE% | | --- | :---: | :---: | :---: | | 2025 | 917 | 682 | 98.3 | | 2024 | 170 | 572 | 49.0 | | 2023 | 144 | 397 | 50.6 | | 2022 | 848 | 351 | 63.5 | Source: SEC companyfacts cache [F1]. Revenue figures not disclosed annually but quarterly snapshots show recent acceleration ## Key Upcoming Catalysts and Monitoring Points Attention should be directed toward several pivotal near-term indicators shaping performance:
- Backlog conversion rates tracking how effectively signed contracts transition into revenue generating trials - a key barometer for sustainable top-line advancement given variability inherent in cancellations/delays[S7,N1]
- Announced new business awards including expansions reflecting pipeline robustness amid evolving pharmaceutical R&D spending cycles especially within targeted therapeutic verticals[N2]
- Regulatory developments impacting clearance timelines across principal jurisdictions influencing overall trial launch cadence potentially affecting Medpace operability especially amid tightening scrutiny/SAR-CoV variants arising affecting global trials execution logistics[N1]
- Geopolitical stability factors modulating cross-border study activities including supply chain resilience required amidst heightened import/export controls relevant for investigational product handling considering Medpace’s broad international reach[N5,N7]
- Continued enhancements or setbacks related AI tool adoption impacting workflow efficiencies deliberately watched closely due diligence indicated potential disruptive force balancing innovation against control risk[S4]
Disclaimer: This is research-only, informational analysis and not investment advice. It may include AI-generated interpretation and general industry context. Always verify important details using primary sources.
Comments