
Meta Platforms Q1 2026 Growth Fueled by Advertising Gains Despite Reality Labs Losses
Strong advertising revenue growth lifted operating income in Q1 2026 as Meta advances AI and immersive computing investments.
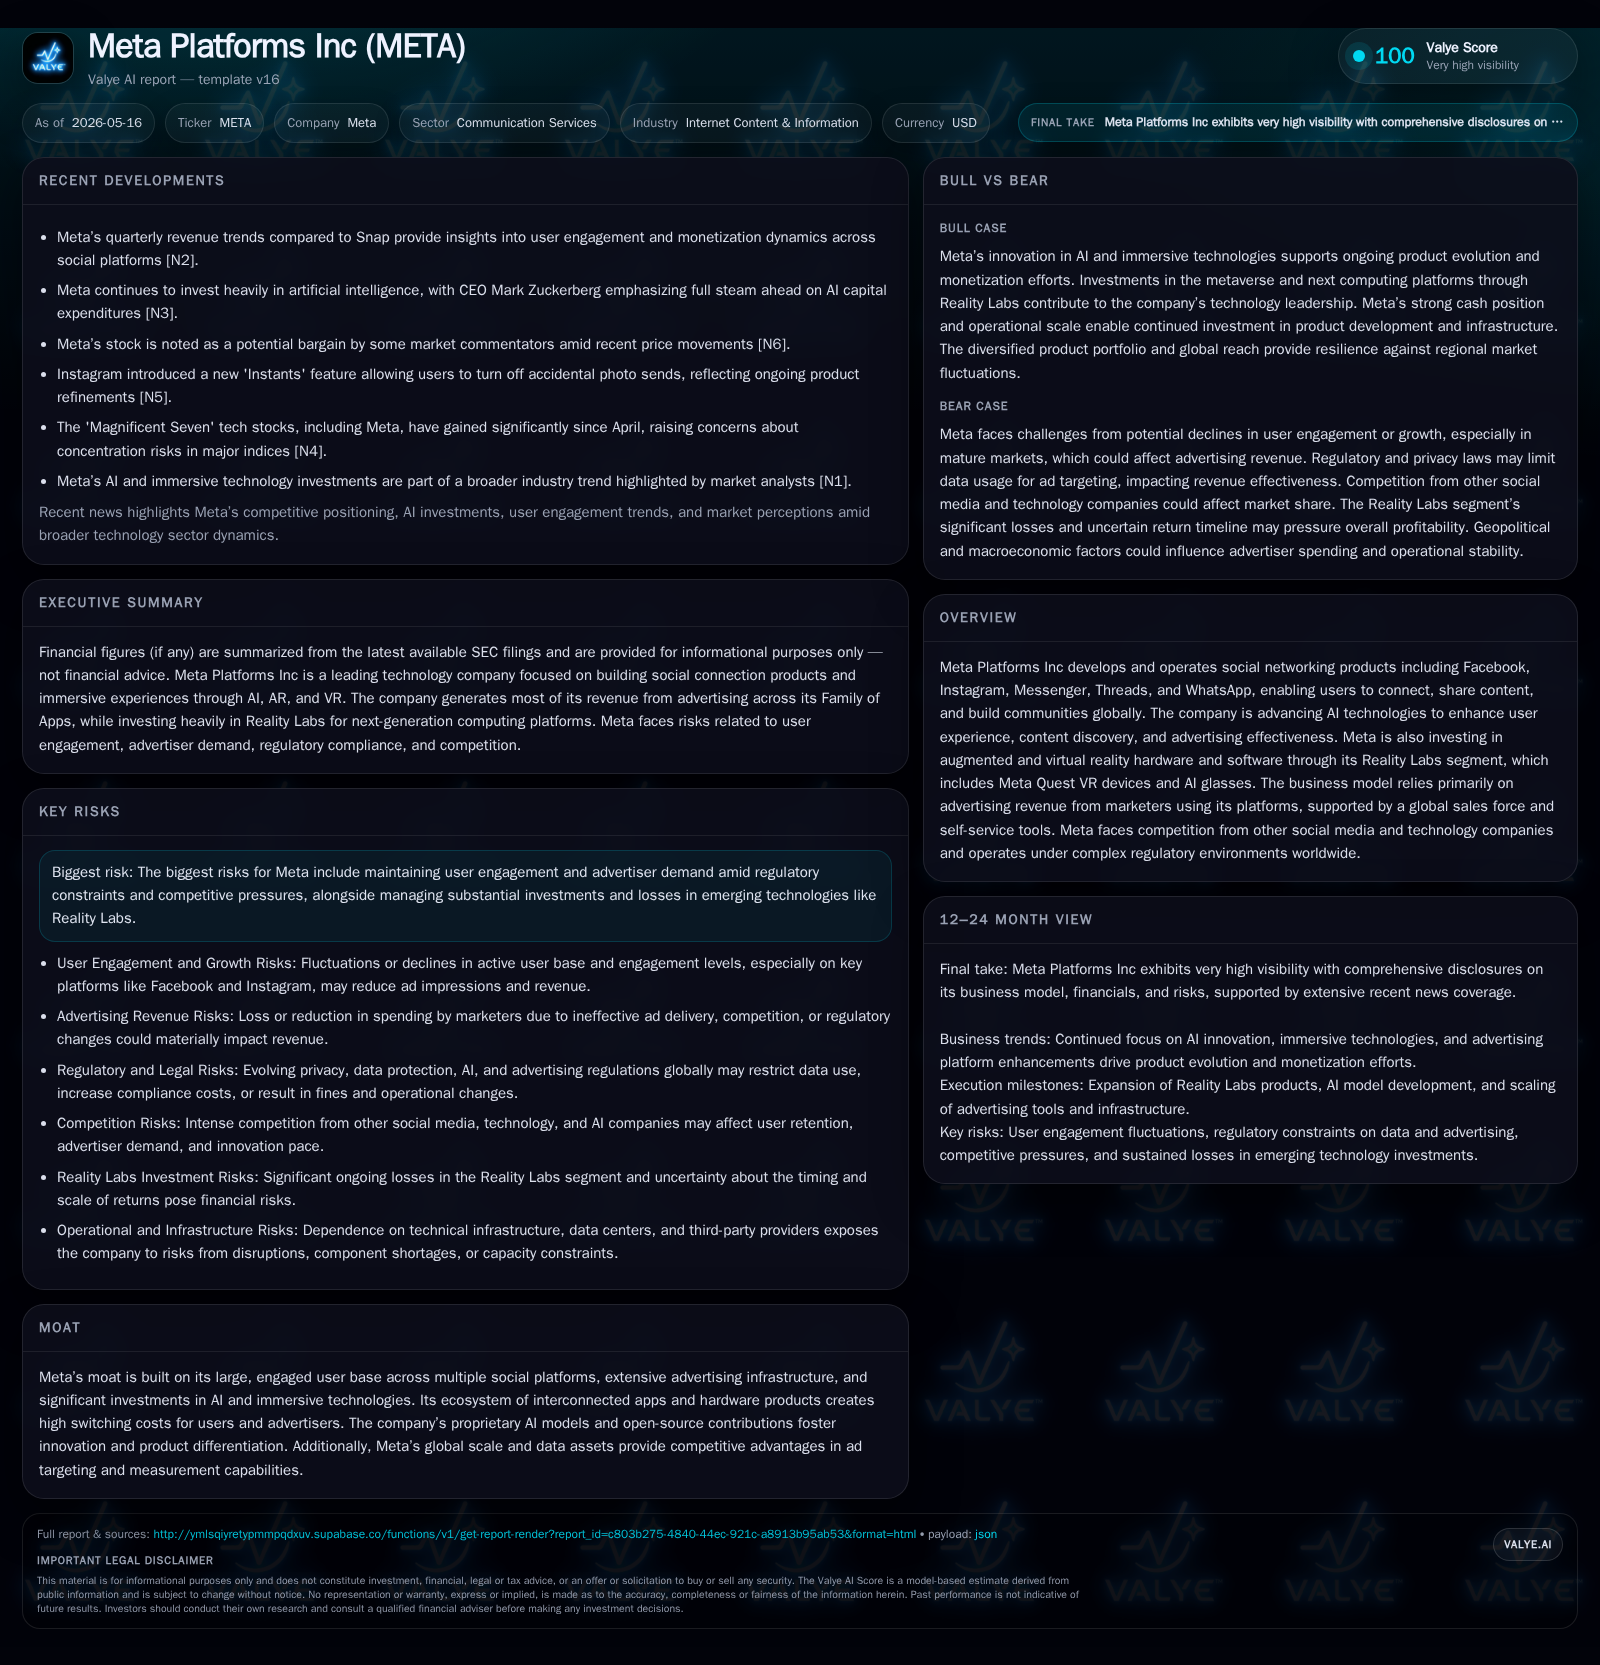
Meta Platforms reported a robust 33% increase in total revenue for Q1 2026, driven primarily by its Family of Apps segment through higher ad impressions and price per ad. Despite sustained losses in its Reality Labs division, Meta’s overall operating income rose 30% year-over-year. The company continues to leverage its massive user base and AI investments to maintain competitive advertising effectiveness while investing heavily in metaverse-related hardware and software. Regulatory pressures and legal risks remain key challenges, alongside the high cost of scaling new platforms. Monitoring user engagement metrics, advertiser demand, and execution on immersive technology will be critical milestones in 2026.
Recent Operating Update: Q1 2026 Financials
Meta Platforms’ latest quarterly results ending March 31, 2026 reveal strong underlying growth driven by advertising amidst a challenging investment landscape for new technologies [S2]. Consolidated revenue surged 33% year-over-year to $56.31 billion — a robust acceleration fueled primarily by the Family of Apps (FoA) segment’s $55.91 billion in revenue (up 33%). This was underpinned by a 19% increase in ad impressions delivered across Facebook, Instagram, Messenger, WhatsApp, and other apps alongside a notable 12% rise in average price per ad.
While the Reality Labs (RL) segment saw a slight decline in revenue (down 2% to $402 million), operating losses narrowed modestly to $4.03 billion from $4.21 billion last year. Overall operating income grew by 30% to $22.87 billion largely attributable to the FoA segment’s income growth of 24%. Increased costs—mainly infrastructure investment and employee compensation—partially offset gains but did not derail margin expansion outside RL. Net income reached $26.77 billion with an effective tax rate impacted by transitional relief measures [S2][F1].
Liquidity remains ample with cash and equivalents at $23.4 billion as of quarter-end; total long-term debt stood at approximately $59 billion with net debt near $35.6 billion based on the most recent annual data [F1]. Capital expenditures ran high at nearly $20 billion reflecting ongoing scale-up of data centers and hardware efforts.
Business Model: Advertising-Driven Network with Immersive Bets
Meta’s primary value proposition lies in its family of interconnected social platforms generating vast engagement breadth worldwide—providing marketers with detailed targeting enabled by extensive data signals from user interactions both within and beyond its apps [S1]. Revenue is overwhelmingly advertising-based where companies pay to place ads optimized by Meta’s proprietary AI-driven tools that target precise audiences.
Key drivers of revenue growth entail increasing ad inventory (impressions), improving pricing via better engagement or targeting precision, plus new formats such as video reels or interactive ads enhancing effectiveness. Users largely consume free content powered by these ads; thus user volume/daily engagement is crucial for monetization.
Meanwhile Reality Labs embodies Meta’s strategic pivot to shape the “next computing platform” — an ecosystem encompassing VR headsets (Meta Quest), AR glasses integrating AI assistants, software platforms, and content creation tools aiming to create immersive social experiences beyond traditional screens [S1]. Although currently loss-making owing to hardware manufacturing costs, R&D expenses for software and new AI models are intended as long-term value drivers balancing short-term profitability pressure.
Industry Structure and Competitive Position
Meta sits atop highly concentrated digital advertising markets alongside Google and newer challengers like TikTok (ByteDance). While dominance comes from massive scale—over 3.5 billion daily active users across FoA apps—the landscape remains dynamic with innovation cycles characterized by rapid shifts in user preferences towards video-first content and privacy-driven changes limiting data granularity.
Competitive pressure is compounded by increasing regulatory interventions imposing constraints on data use (GDPR, CCPA), youth safety laws, content moderation obligations, and antitrust scrutiny targeting past acquisition behaviors [S4][S7][S10]. Competitors push aggressively on product features (e.g., Snapchat's AR filters) and advertiser tools impacting market share dynamics.
Meta’s moat stems from:
- Cross-platform integrated experience tying Facebook social graph to Instagram visual culture plus WhatsApp/Messenger communications,
- Advanced proprietary AI solutions powering personalization,
- Enormous global salesforce coupled with self-service demand-side platforms,
- Expansive first-party data assets ensuring competitive ad targeting partly insulated from third-party cookie restrictions.
However, the costly horizon bets on metaverse infrastructure pose execution risk amidst heightened investor scrutiny.
Growth Drivers
Advertising Expansion: Continued volume uplift from broader internet penetration plus incremental yield improvement through higher average prices per ad due to AI-driven targeting refinements constitutes the core driver [S2].
AI Investment Leverage: AI underpins multiple facets—content relevance algorithms increasing user time spent; generative features enabling novel creative formats; improved measurement accuracy that boosts advertiser ROI—supporting structural pricing power inside ads [S1].
User Base Expansion & Engagement: Incremental gains in daily active people (+4% YoY) alongside richer engagement formats (Reels growth) expand monetizable opportunities [S2].
Reality Labs Ecosystem Development: Though immature today financially, accelerating adoption of Quest VR devices and nascent AR glasses could open new multi-billion-dollar market channels if stickiness builds [S1]. Strategic partnerships for content creation or developer tools would help embed Meta deeply into emerging virtual economies.
Geographic Market Diversification: While mature North America & Europe contribute disproportionately higher monetization rates today, Asia-Pacific markets offer significant scale potential despite lower unit ad values—structurally growing international revenue streams [S2].
Risks and Constraints
Regulatory and Legal Scrutiny: Ongoing antitrust investigations (FTC lawsuits seeking divestitures), GDPR compliance issues including multi-hundred-million Euro fines in Europe, evolving privacy mandates affecting targeting accuracy represent major overheads with uncertain outcomes [S4][S7][S10][S13][S16].
User Engagement Fragility: Social platforms must continuously innovate features to retain users amid competition; failure reduces data volumes crucial for ads.
Ad Revenue Dependence: Concentration on advertising leaves Meta vulnerable to macroeconomic cycles impacting marketing budgets or shifts towards alternative channels.
Execution Risk on Emerging Product Lines: Reality Labs’ continuing losses require large capital input without guaranteed product-market fit or consumer adoption trajectory clarity.
Technological Shifts Impacting Monetization: Mobile OS policies restricting tracking/data sharing constrain signal availability hurting ad personalization efficacy.
Litigation Costs & Outcomes Uncertainty: Multiple class actions around privacy violations or copyright infringement raise risk of significant damages or mandated business modifications [S16][S23].
What To Watch Next
- Quarterly metrics for Family DAP trends; expanded Reels usage statistics; average price per ad trends signaling pricing power sustainability [S2].
- Reality Labs sales volumes/average selling prices; product launch timelines around next-gen AR glasses or VR software capabilities [S3][N7].
- Resolution or status updates on FTC antitrust litigation including any injunctions or consent orders modifying operating models [S10][S13].
- Regulatory developments in Europe regarding compliance with DMA/DSA rules affecting content moderation and data processing [S14][S17].
- Capital expenditure pacing relative to cash flow generation pointing to balance sheet flexibility.
- Investor disclosures tied to share repurchase program activity or dividend policy adjustments as signals of financial confidence [S15][S8].
Financial Profile Brief Overview
Latest financial snapshot
| Metric | Value | Period |
|---|---|---|
| Cash & equivalents | $23.4bn | |
| 2026-03-31 | ||
| Total debt | $59.0bn | |
| 2025-12-31 | ||
| Net debt | $35.6bn | |
| 2025-12-31 | ||
| Current assets | $109.8bn | |
| 2026-03-31 | ||
| Current liabilities | $46.8bn | |
| 2026-03-31 | ||
| Current ratio | 2.35x | |
| 2026-03-31 |
Source: SEC companyfacts cache [F1].
For Q1 2026 ending March 31, Meta reported: Robust cash flow ($32.2 billion operating cash flow for the quarter) supports ongoing heavy investments in capex (~$19.8 billion this quarter) focused on infrastructure expansion needed both for AI model training support and Reality Labs hardware production scale-up [S2][F1].
Disclaimer: This is research-only, informational analysis and not investment advice. It may include AI-generated interpretation and general industry context. Always verify important details using primary sources.

Comments