
Miller Industries’ 2025 Profit Collapse Tests Service and Innovation Leadership
Severe market headwinds led to a sharp earnings decline for Miller Industries in 2025, challenging its established distributor moat and innovation-driven strategy.
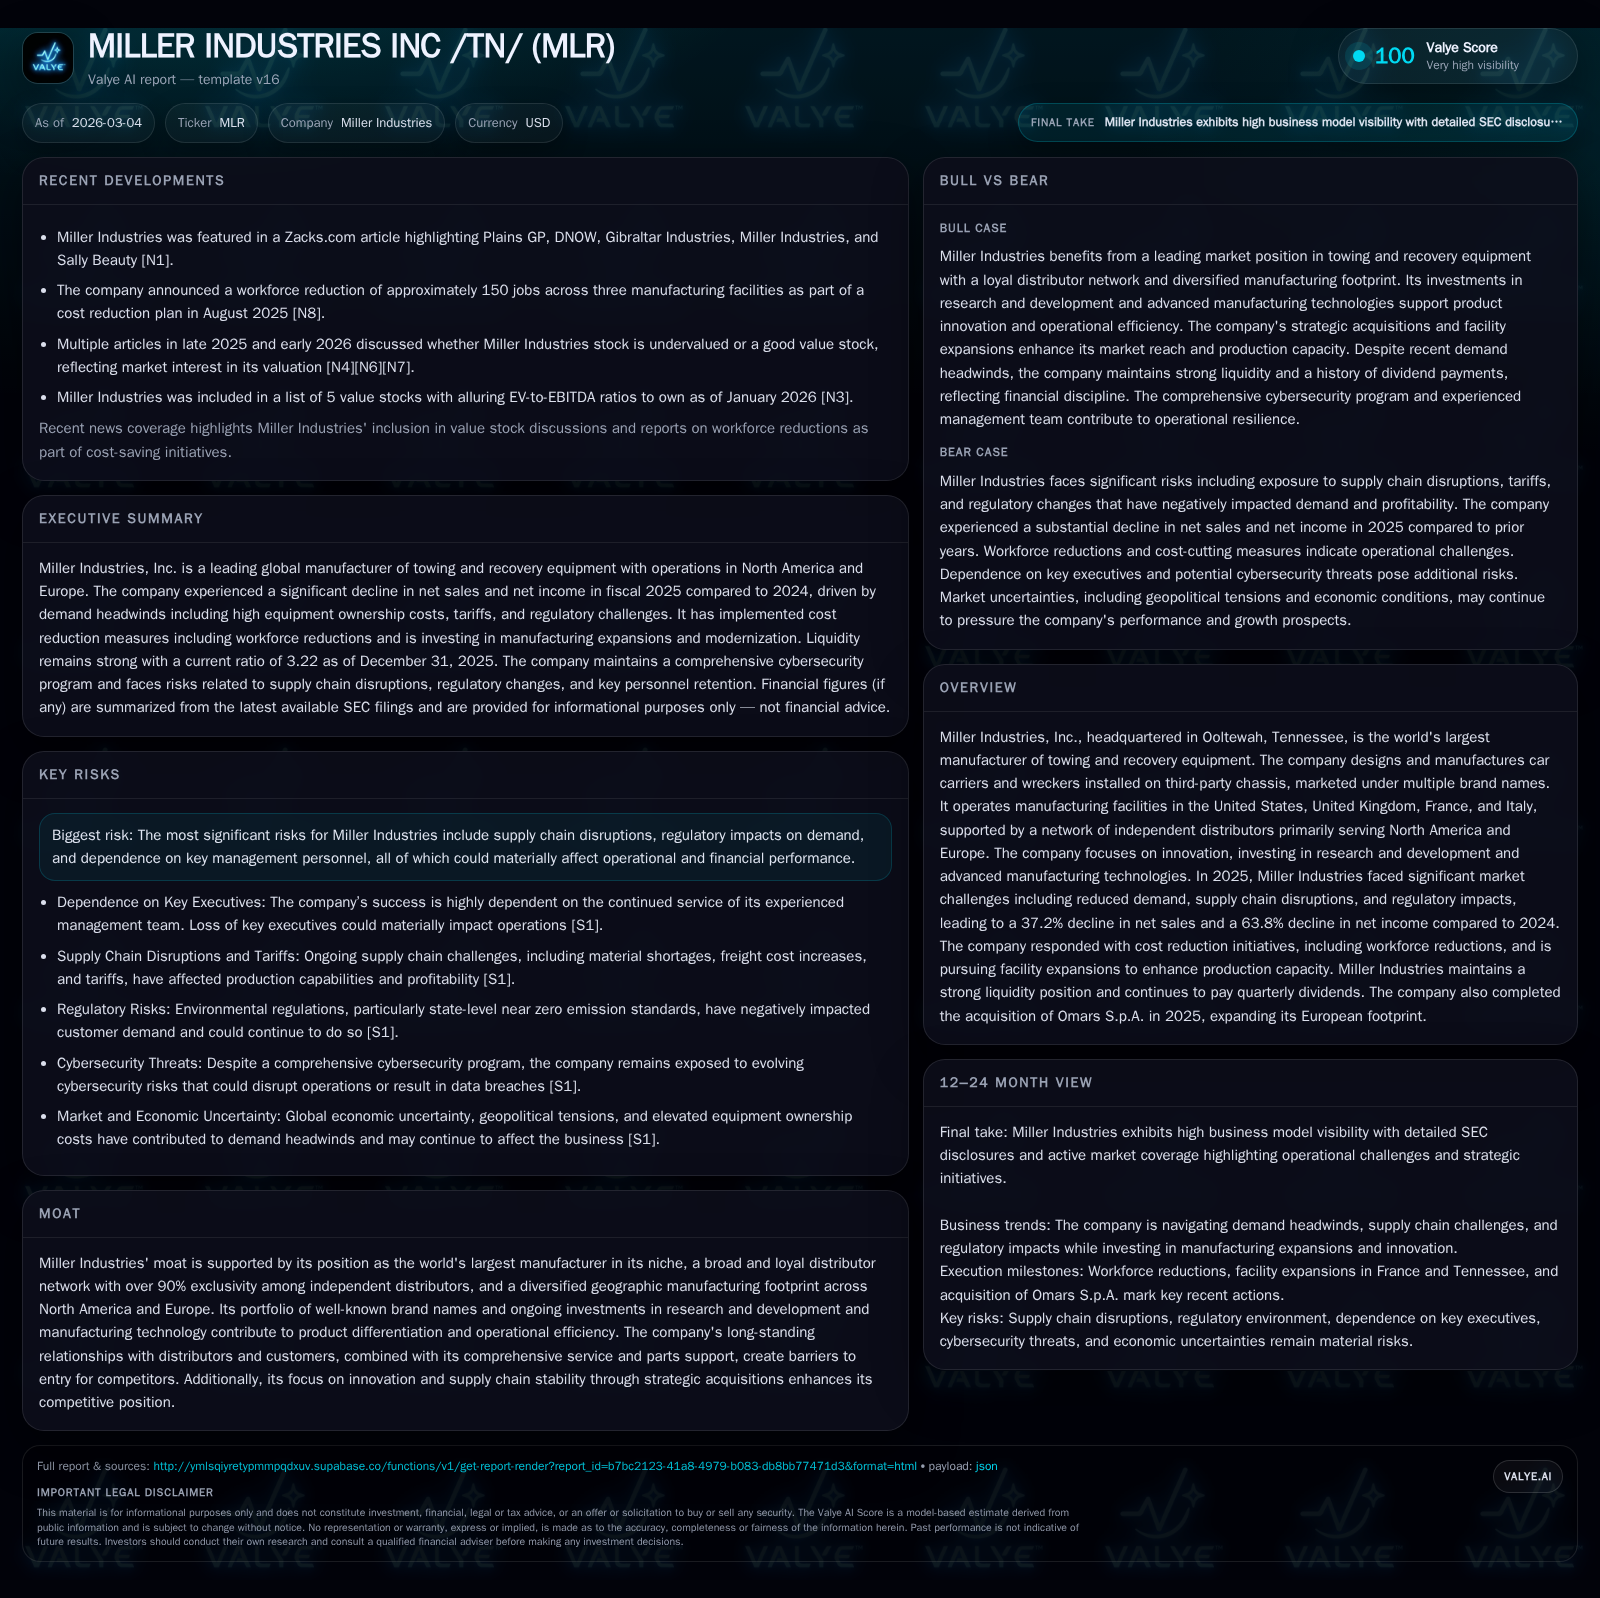
Miller Industries experienced a pronounced contraction in 2025, with net sales falling by over 37% and net income tumbling nearly 64%, reflecting significant supply chain disruptions, regulatory pressures, and reduced demand. Despite these setbacks, the company’s dominant position as the largest global manufacturer of towing equipment, its highly exclusive distributor network, and ongoing investments in advanced manufacturing underscore resilience. A striking surge in operating cash flow contrasts with the earnings drop, highlighting working capital shifts amid inventory correction. The company's disciplined capital allocation through dividends and share repurchases, alongside a strong liquidity profile supported by a $100 million credit facility, positions it to manage near-term volatility. Risks around key executive dependencies and evolving regulations persist as critical factors to monitor.
Historical Growth Trends and Revenue Drivers Through 2024
Miller Industries cultivated steady top-line growth over recent years culminating prior to the dislocation in 2025. From a base of approximately $160 million in revenue reported in fiscal 2017 [F1], the company steadily expanded its sales via product innovation and an expanding international footprint. Operating income grew from under $10 million in FY2017 to about $14.8 million by FY2020 [F1], demonstrating moderate operational leverage through scale gains.
Net income reflected this trend with earnings increasing consistently through the early 2020s up until reaching almost $63.5 million in FY2024 before plunging dramatically the following year [F1]. Key drivers underpinning this growth were Miller's strong brand portfolio marketed globally under multiple well-established names such as Century�, Vulcan�, and Holmes� among others [S11], combined with manufacturing capabilities across four countries which helped diversify operational risk.
Historical performance (annual)
| FY | Net ($mm) | CFO ($mm) | Capex ($mm) | Net YoY |
|---|---|---|---|---|
| 2025 | 23 | 99 | 14 | -63.8% |
| 2024 | 63 | 17 | 15 | +8.9% |
| 2023 | 58 | 11 | 12 | +186.5% |
| 2022 | 20 | -19 | 29 |
Source: SEC companyfacts cache [F1].
Capital returns and efficiency (annual)
| FY | Div ($mm) | Buybacks ($mm) | FCF ($mm) |
|---|---|---|---|
| 2025 | 9 | 6 | 85 |
| 2024 | 9 | 3 | 2 |
| 2023 | 8 | -1 | |
| 2022 | 8 | -48 |
Source: SEC companyfacts cache [F1].
Note: The specific revenue figures for years other than FY2017 and FY2024 are fragmented; operating income data is primarily available from FY2017-FY2020; net income and cash flow trends reflect available snapshots.
2025 Earnings Plunge: Underlying Market and Operational Factors
Miller Industries confronted severe headwinds during fiscal year 2025 that tested its business model's elasticity profoundly , resulting in net sales dropping sharply by approximately 37.2% year-over-year to around $790 million [F1] from $1.257 billion in the prior year [S11]. The plunge was compounded by cascading supply chain interruptions limiting product availability and generating pricing pressures.
In parallel, regulatory changes dampened demand patterns within the vehicle recovery niche , exacerbating margin compressions at manufacturing sites spread between North America and Europe [S11]. Consequently, net income suffered a disproportionate decline of nearly two-thirds (-63.8%) landing at just above $23 million by end-2025 [F1]. Operating expenses as a percentage of sales escalated notably (SG&A rose from roughly 6.9% to over 11%) reflecting fixed cost absorption challenges during volume contractions [S14].
Interest expense diminished significantly due mainly to reduced debt levels post repayments offset somewhat by rising interest income on receivable accounts [S14]. This contrast signals active balance sheet management amidst operational adversity.
Distributor Network Exclusivity as a Competitive Moat
A pronounced element reinforcing Miller Industries’ market resilience remains its distributor network exclusivity agreements wherein more than 90% of independent distributors sell solely its branded equipment [S11]. This deep-rooted exclusivity arrangement is rare within industrial equipment segments where multi-brand distribution channels prevail.
This arrangement cultivates high switching costs for distributors who prioritize dependable parts availability and superior service — core pillars of Miller’s post-sale value proposition . The network spans North America extensively with meaningful footholds across key European territories facilitated through subsidiaries like Jige International S.A., Boniface Engineering Ltd., and Omars [S11]. This distribution fortress mitigates competitive entry risks even amid uneven macroeconomic cycles.
Innovation Strategy Amid Regulatory and Supply Chain Headwinds
Despite challenging market conditions during 2025, Miller Industries has maintained focus on its research & development agenda alongside targeted upgrades to manufacturing technologies leveraging automation and precision tooling enhancements [S25]. Investment activity totaled approximately $13.7 million in capital expenditures during the year—down from prior levels but reflecting prudence rather than abandonment of productivity improvements [F1][S25].
This emphasis on technological differentiation aims to counteract persistent supply chain fragilities by enabling leaner build-to-order production runs while advancing product features responding to evolving industry standards influenced by regulatory reforms [S25]. Such forward-looking initiatives complement Miller’s broad product suite supporting their claim as the world's preeminent towing equipment manufacturer.
Evaluating Cash Flow Surge Versus Net Income Decline
While earnings contracted sharply, operating cash flow for fiscal year 2025 soared by over fourfold (+485%) reaching nearly $98.7 million compared with just $16.9 million in the prior year [F1][S19]. This stark divergence reflects notable working capital improvements driven primarily by reductions in accounts receivable balances alongside inventory depletion within the distribution channel — suggesting effective channel inventory correction during a period of lowered sales velocity.
The resultant free cash flow (operating cash flow minus capex) exceeded $85 million for the year ending December which alleviated liquidity pressures despite profitability challenges [F1]. This contrast portrays a classic decoupling scenario where accrual-based earnings metrics are suppressed by temporary accounting impacts versus underlying cash generation strength affording corporate flexibility.
Capital Allocation Tactics: Dividends, Share Repurchases, and Capex Discipline
Throughout turbulence culminating in fiscal 2025 results, Miller Industries elected measured capital return policies coupled with disciplined spending. Annual dividends climbed modestly reaching an aggregate payout of about $9.15 million or $0.80 per share marking steady commitment since inception of distributions back in May 2011 [F1][S6]. Dividend continuity was maintained notwithstanding covenant constraints tied to credit agreements.
Share repurchase activity accelerated significantly under an open-ended program authorized in April 2024 with spend doubling year-over-year totaling nearly $6 million for approximately144 thousand shares retired at average prices considerably below prior periods averaging ~$41 per share versus ~$58 previously [F1][S4][S6][S7].
Capital expenditures shrank modestly from prior years’ levels reflecting postponed or optimized investment projects without compromising strategic capacity expansions or process improvements [F1][S25]. Overall return on equity remained respectable at an estimated ~10% based on trailing net income against shareholders' equity balances from circa FY2018 filings extrapolated conservatively [F1].
Liquidity Status and Balance Sheet Strength
Liquidity at fiscal year-end displayed marked strength facilitated by cash and equivalents doubling over one year from roughly $24 million to nearly $44.7 million amid prudent working capital policies as described earlier [F1][S5][S8][S9]. Concurrently, access under a revised unsecured revolving credit facility expanded substantially from an initial ceiling of $50 million raised to a more flexible $100 million limit maturing May 31, 2027 providing ample dry powder for operational funding or opportunistic uses [S5][S16].
As of December-end, outstanding borrowings stood at about $30 million down substantially from prior year draws totaling approximately $65 million evidencing conscious deleveraging strategies matched with improving cash flows [S16]. The company comfortably remained compliant across all facility covenants including leverage ratios and tangible net worth tests ensuring operational freedom around dividend payments or discretionary expenditures per lender terms [S16][S29].
Working capital itself delivered sound coverage with current assets exceeding liabilities yielding a robust current ratio near 3.22 reflecting ample short-term asset cushions relative to obligations owed within twelve months [F1]. Given this liquidity backdrop alongside improving free cash flow generation prospects, Miller appears positioned prudently against near-term economic uncertainties.
Risks From Key Management Dependencies and Regulatory Shifts
The firm's operations substantively depend on continuity within its senior management cadre whose collective tenure rewards institutional knowledge yet constitutes key-man risk should unexpected departures occur adversely impacting strategic direction or operational agility [S20][S1][S2]. Succession planning measures remain critical yet sparse details are reported publicly necessitating investor vigilance.
On another front, evolving environmental regulations affecting vehicle emission standards or safety protocols possess inherent unpredictabilities influencing order patterns especially among governmental clients—a sizable market segment serviced directly or through prime contractors—posing material demand side risks when intensifying abruptly [S20].
Cybersecurity controls receive dedicated board-level governance supported by rigorous internal audits coupled with independent testing regimes employing multifactor authentication methods plus third-party penetration testing exercises designed to mitigate exposure across increasingly digitalized operations and vendor ecosystems—a forward-thinking approach mitigating but not eliminating cyber incident possibilities that could disrupt service continuity or data integrity impacting reputation or financial performance materially if realized [S1].
Outlook: What Market Signals to Watch for Future Growth Resumption
Explicit guidance remains unavailable post-2025 reporting cycle; however monitored indicators should include distributor order intake rebound patterns signaling restored market confidence alongside normalization of supply chain logistics reducing component shortages currently constraining production throughput (analysis). Equally important will be successful introduction cycles of technologically innovative product lines—particularly those integrating telematics or enhanced safety features aligned with tightening regulatory environments (analysis).
Cost structure improvements especially pertaining to fixed overhead absorption efficiencies during volume ramp-ups offer further scope for margin recapture (analysis). Given Miller’s historically low multi-brand competition penetration within its primary distribution channels combined with sustained R&D investments positioning it well for competitive differentiation midterm (analysis).
In sum, Miller’s ability to translate strong balance sheet health plus operational discipline into renewed profitable growth will be critical both as an indicator of resilience within this specialized industrial niche as well as for reaffirming confidence among stakeholders watching progress beyond pandemic-era market disruptions.
Disclaimer: This document provides an analytical summary based exclusively on company disclosures ([F1],[S#]) without offering any investment recommendations or price forecasts.
Disclaimer: This is research-only, informational analysis and not investment advice. It may include AI-generated interpretation and general industry context. Always verify important details using primary sources.
Comments