
Madison Square Garden Sports Corp. Faces Earnings Pressure Amid Spin-Off Plans and Rising Costs
MSGS reports lower adjusted operating income in Q3 FY2026 due to higher expenses despite revenue gains, while exploring a Rangers spin-off.
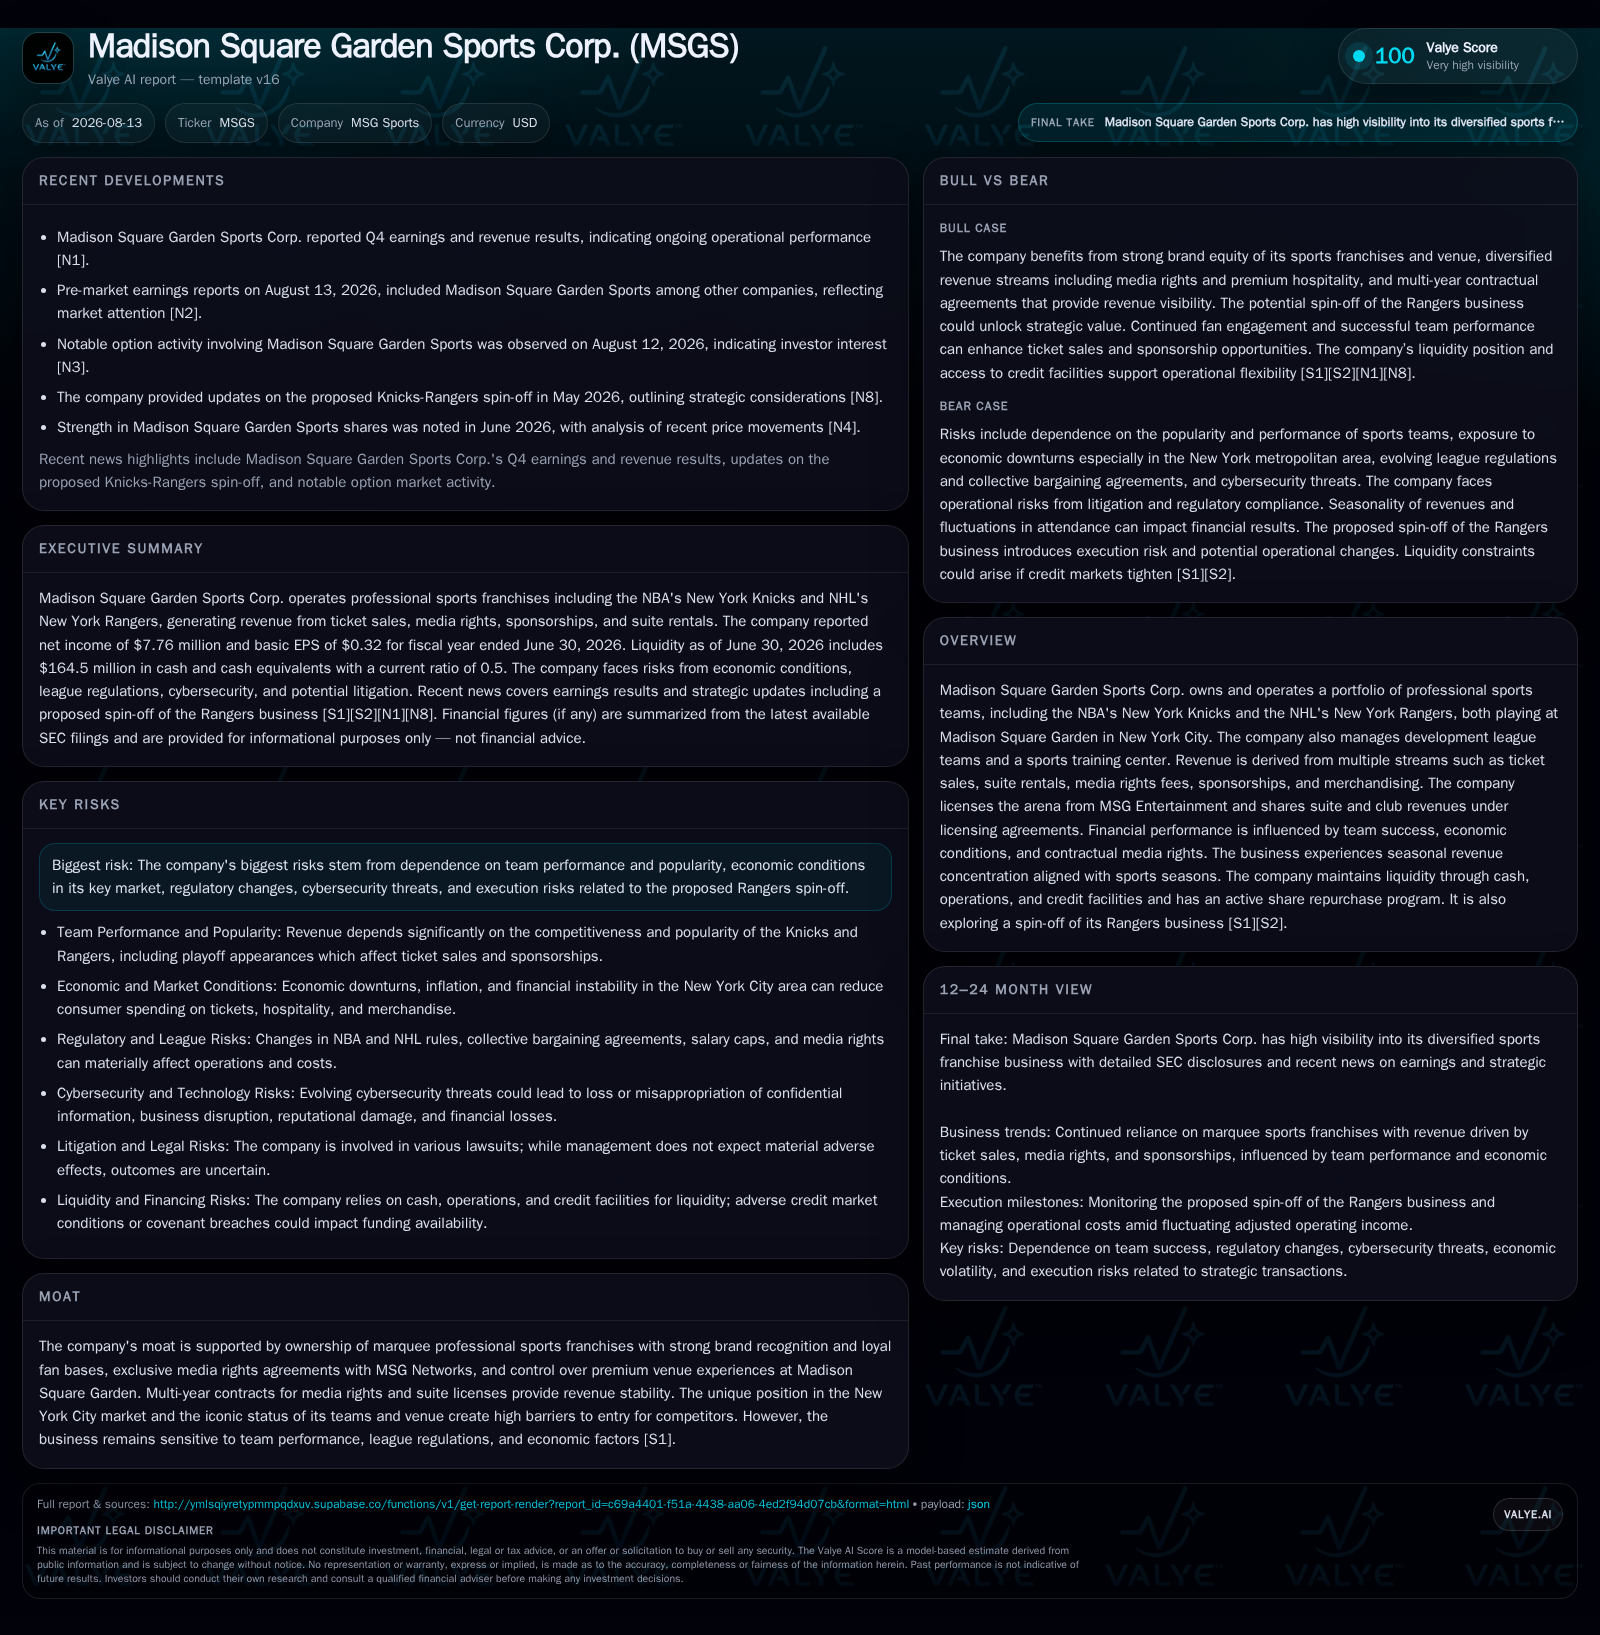
Madison Square Garden Sports Corp. (MSGS) reported a 72% decline in adjusted operating income for Q3 FY2026 compared to last year, mainly driven by rising direct operating costs partially offset by revenue growth [S2]. The company is managing financial pressures alongside executing a potential spin-off of its New York Rangers business to create two distinct publicly traded entities [S20, S3]. MSGS relies on multiple revenue streams including ticket sales, media rights, sponsorships, and merchandising, all influenced heavily by team performance and seasonality [S1]. Liquidity remains sufficient with $164.5 million in cash as of June 30, 2026 and available credit facilities, although the current ratio remains low at 0.5 due to high current liabilities [F1]. MSGS's moat derives from its marquee NBA and NHL franchises, exclusive media agreements, and premium venue licensing arrangements with MSG Entertainment [S1].
Recent Operating Update
In parallel with financial reporting, MSGS revealed it is actively exploring a corporate restructuring involving spinning off its New York Rangers hockey business into an independent publicly traded entity separate from its Knicks NBA operations [S20][S3]. This strategic initiative aims to unlock value by separating the economics and operational profiles of these iconic sports franchises but carries execution risk dependent on league approvals and tax considerations.
Business Model Analysis
MSGS monetizes its portfolio of sports franchises through multiple well-established revenue streams characteristic of professional sports ownership: ticket sales (including premium seating), suite rentals under venue licensing contracts with MSG Entertainment (facility owner), lucrative local media rights fees primarily via MSG Networks, corporate sponsorships tied to both teams' high-profile brands, and branded merchandising operations [S1]. The company operates within the tightly regulated NBA and NHL ecosystems where league-wide national broadcast contracts provide material revenue backstops but local media rights remain key drivers of incremental profitability.
Venue licensing plays a pivotal role; MSGS leases Madison Square Garden under long-term Arena License Agreements that govern suite usage rights and associated premium client experiences generating stable recurring revenues beyond gate receipts alone [S1]. This arrangement enhances margin stability relative to pure ticket sales but introduces dependence on third-party venue ownership dynamics.
Revenue generation is subjected to considerable seasonality given the concentrated NBA and NHL playing schedules which compress game days into defined calendar quarters. Concurrently, team performance directly influences attendance per game, average ticket prices realized, suite occupancy rates, merchandise volume sold onsite or digitally, and season ticket renewals—all critical KPIs that oscillate with win-loss records and playoff participation.
Industry Structure & Competitive Position
Within the professional sports entertainment landscape, MSGS occupies the exclusive niche of owning marquee teams deeply embedded in one of the largest media markets globally—New York City. This bestows competitive advantages including unparalleled brand recognition and extensive fan loyalty which underpin sustainable consumer engagement metrics relative to many peer franchises across NBA/NHL leagues.
The company's exclusive local media rights contracts with MSG Networks provide stable annuity-like cash flows insulated from short-term fluctuations while commanding premium advertising rates due to concentrated viewership demographics [S17]. Similar peers encompassing franchise owners often share this dual reliance on gate receipts coupled with sub-licensed broadcast agreements but lack MSG's iconic asset mix combining Knicks and Rangers plus proximity to Madison Square Garden.
However, scale also translates into operational complexities including negotiating arena licenses that determine pricing power for suites/premium seats—a significant margin lever—and managing labor relations amid collective bargaining agreements covering approximately 12% of workforce under union CBAs without imminent renewal expirations complicating cost control efforts as detailed by management disclosures [S17]
Growth Drivers
Key growth initiatives include renewal or expansion of lucrative local media rights deals underpinned by evolving digital streaming platforms enhancing monetization beyond traditional cable broadcasts. Enhanced sponsorship partnerships leveraging heightened fan engagement through improved team competitiveness could drive incremental non-ticket revenue.
Innovations around premium seating experiences at The Garden combined with new suite offerings aimed at corporate clients serve as another growth vector given willingness-to-pay among affluent consumer segments in NYC’s diverse business environment.
Merchandising efforts focused on brand licensing expansions into new fan demographics domestically or internationally also align with wider industry trends toward ancillary asset development including training centers metrics likewise contributing modestly currently but offering longer-term upside potential.
Risks & Watchpoints
MSGS’s fortunes remain tightly coupled to variable factors such as team success impacting fan attendance/merchandise demand—highlighted during recent quarterly flattening or declines in profitability despite growing revenues—exposing it to competitive dynamics not easily neutralized over short horizons.
Economic sensitivities affecting discretionary entertainment spend in the NYC metro area pose another material risk. Regulatory developments within NBA/NHL frameworks or unexpected collective bargaining outcomes could elevate costs or constrain operational flexibility further amplifying margin pressures.
Notably cybersecurity risk looms given reliance on digital ticketing/payment platforms; any disruption could incur reputational damage alongside financial repercussions per noted disclosures [S1]. Execution risk related to completing the Rangers spin-off transaction introduces near- to mid-term uncertainty encompassing league approvals and tax structuring requirements that must be monitored closely for timing clarity.
Liquidity management remains critical due to seasonality inducing cash flow swings; cash balances stood at $164.5 million as of June 30, 2026, with borrowing capacity totaling approximately $433 million [F1][S6]. Nonetheless, current liabilities exceed current assets resulting in a low current ratio (~0.5), reflecting working capital intensity characteristic of ticket deposits and deferred revenues tied tightly to seasonal event cycles [F1].
What To Watch Next
Media rights contract renewals/discussions will also be key forward-looking indicators influencing future revenue predictability especially if structural shifts emerge from evolving content delivery technologies or competitive bids among broadcast buyers. Attendance trends per game alongside suite occupancy rates may offer early signs of whether pricing power or consumer sentiment is strengthening or waning following recent periods of elevated direct costs impacting margins.
Financially, total debt stood near $247 million with net debt around $82 million as of June 30, 2026, supporting a modest leverage profile given asset base scale including intangible assets and right-of-use lease assets [F1]. Utilization patterns under Knicks & Rangers revolving credit agreements and borrowing capacity of approximately $433 million provide funding optionality beyond core operations [F1][S21].
Financial Profile Discussion
As of June 30, 2026, Madison Square Garden Sports Corp.'s balance sheet reflects $164.5 million in cash and cash equivalents backed by total debt near $247 million yielding net debt around $82 million favoring modest leverage profile given asset base scale through intangible assets (goodwill ~$227M) and long-lived right-of-use lease assets ($741M) linked predominantly to venue/license arrangements [F1][S14]
Disclaimer: This is research-only, informational analysis and not investment advice. It may include AI-generated interpretation and general industry context. Always verify important details using primary sources.

Comments