
NextEra Energy’s Strong Q1 2026 Performance and Strategic Position in Regulated Utilities
NextEra Energy reported robust first-quarter results, underpinned by its regulated utility and clean energy assets, reinforcing its competitive moat amid sector challenges.
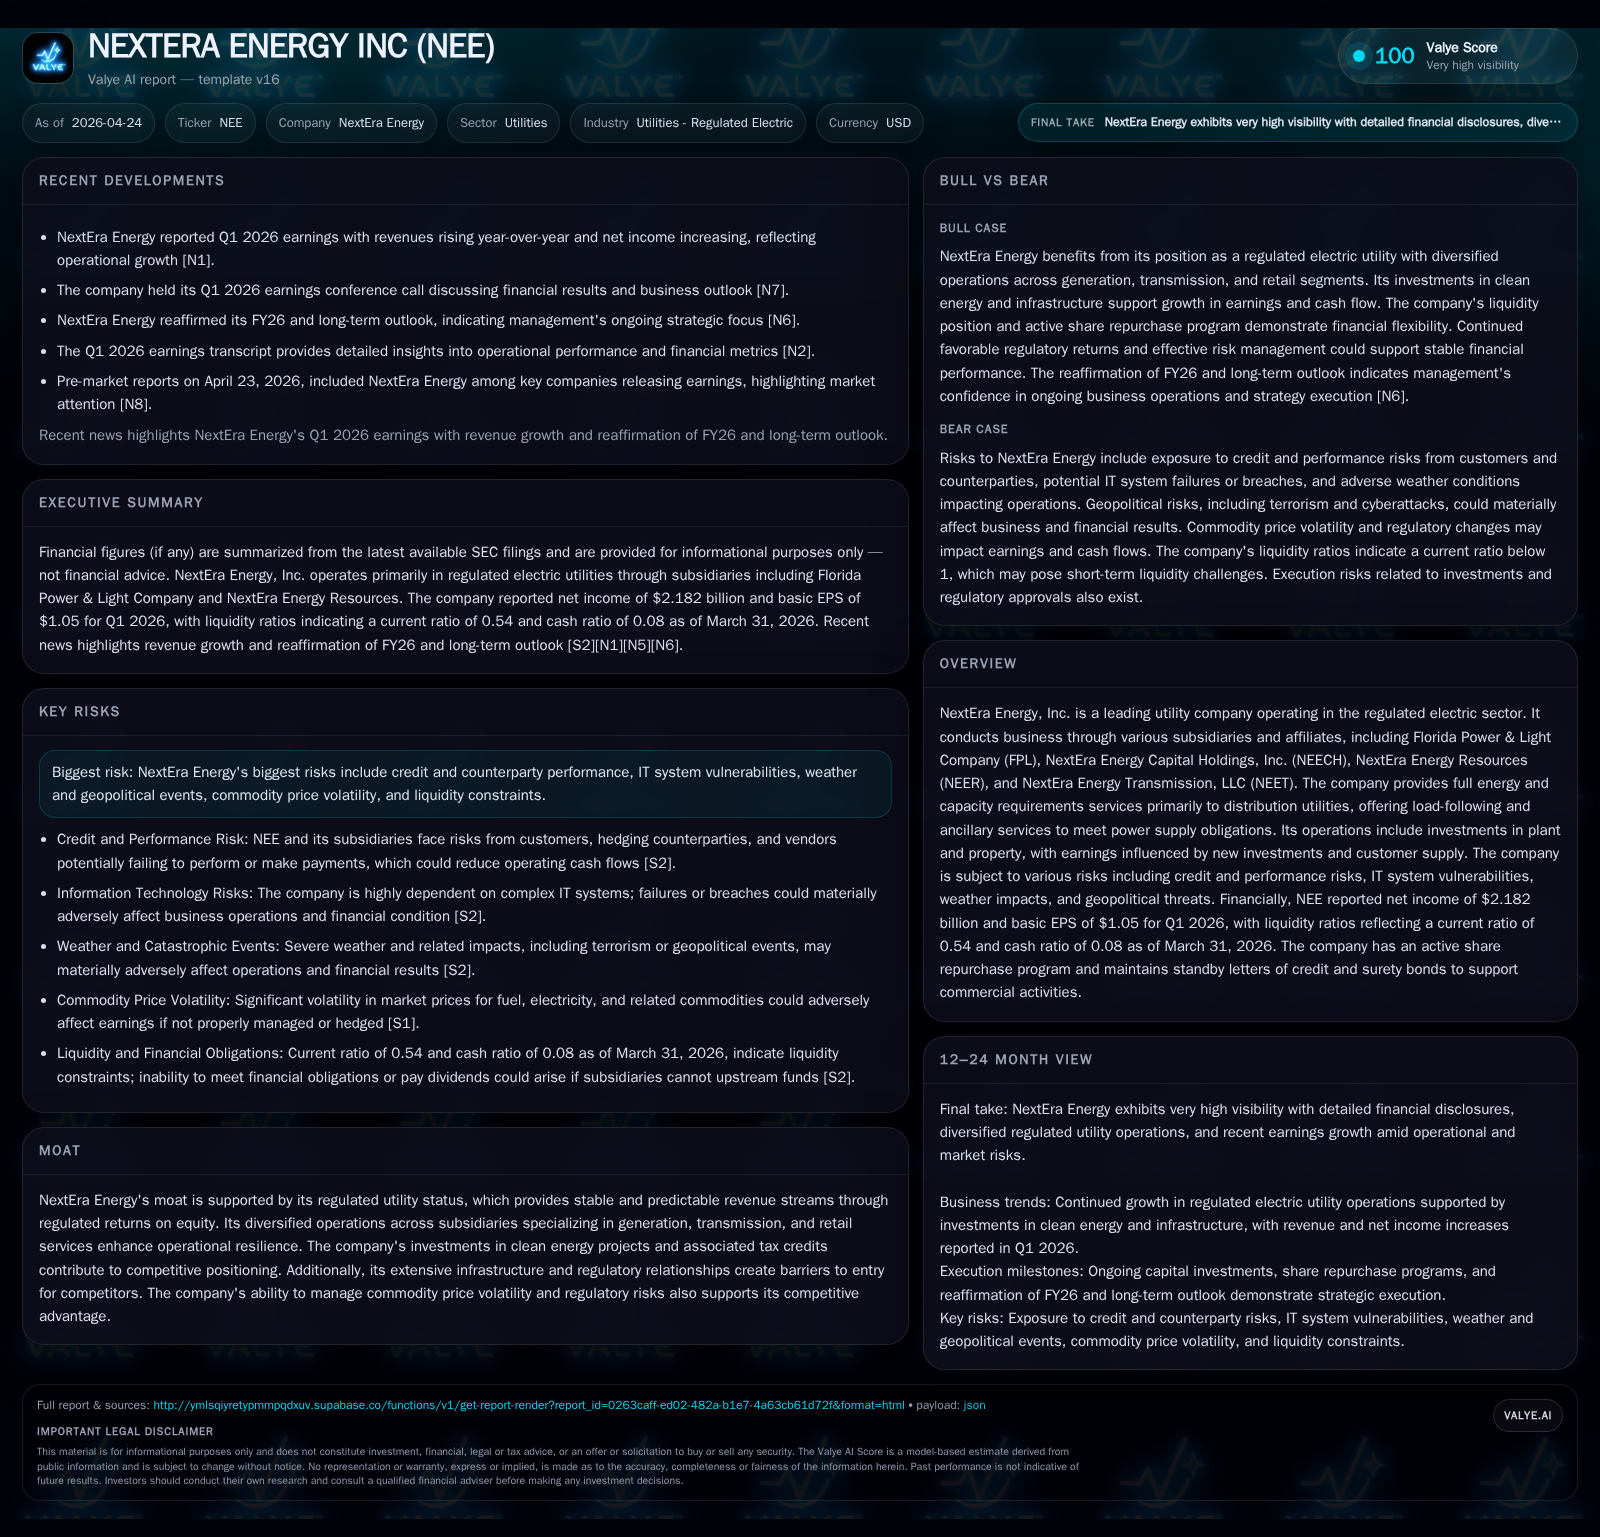
In its latest 10-Q filing for Q1 2026, NextEra Energy delivered net income of $2.182 billion with basic EPS of $1.05, surpassing market expectations and signaling positive momentum. The company’s diversified business model spans regulated retail electric utilities, renewables generation, and transmission infrastructure, benefiting from regulatory frameworks that support steady returns. Growth drivers include continued investment in clean energy projects backed by tax incentives, stable demand from Florida Power & Light’s customer base, and expansion through affiliated entities. Near-term constraints include regulatory uncertainties, commodity price volatility, weather risks, and IT vulnerabilities. The balance sheet shows elevated debt levels consistent with capital-intensive growth but ample liquidity to support ongoing investments. Monitoring regulatory approvals and project execution will be critical to assessing NextEra’s trajectory.
Recent Operating Update
NextEra Energy’s latest quarterly filing dated April 23, 2026 (Form 10-Q) reveals continuing operational strength entering fiscal year 2026 [S2]. The company reported net income of approximately $2.182 billion in Q1 2026, translating to basic earnings per share of $1.05 [N1][S3]. This performance notably exceeded consensus analyst expectations, buoyed by effective management of its diverse business units: Florida Power & Light Company (FPL), NextEra Energy Capital Holdings (NEECH), NextEra Energy Resources (NEER), and NextEra Energy Transmission (NEET).
The MD&A highlights ongoing investments in renewable energy assets and transmission infrastructure paired with steady demand across regulated utility segments [S2]. Despite challenges such as commodity price fluctuations and localized severe weather impacts inherent to utilities, NextEra’s integrated portfolio facilitates balanced risk exposure.
Capital allocation data from the quarter shows moderate share repurchases—around 401 thousand shares at an average price near $93.80—and no unexpected shifts in dividend policy [S2]. Rule 10b5-1 trading arrangements reflect orderly insider transactions without signaling market concerns [S2].
Business Model Overview
NextEra Energy operates through multiple tightly integrated subsidiaries each specializing in key value chain components within the U.S. electric utility sector [S1]. The cornerstone is Florida Power & Light, the largest rate-regulated electric utility subsidiary predominantly serving Florida's residential and commercial customers under extensive regulatory oversight by the Florida Public Service Commission (FPSC). FPL provides full energy requirements services relying on a diversified mix of generation facilities including natural gas-fired plants complemented increasingly by renewable capacities.
NextEra Energy Resources encompasses wholesale energy production primarily from renewable sources such as wind, solar photovoltaic farms, battery storage projects, and nuclear generation—some operated through NEET which owns transmission assets bridging generation sites to regional grids. This segment benefits from long-term power purchase agreements (PPAs) often with distribution utilities or corporate off-takers.
The company monetizes its investments through regulated return on equity (ROE) mechanisms in the retail utility segment while generating merchant-like returns on unregulated renewables under PPAs or other contractual frameworks. Additionally, tax incentives like production tax credits (PTCs) materially improve economics for renewable projects fostering continuous capacity additions [S1].
Operationally, load-following capability is a strategic strength allowing tailored power delivery aligned with variable customer demand profiles while ancillary services stabilize grid operations [S2]. The portfolio span across generation technology types hedges fuel price volatility risks.
Industry Structure and Competitive Position
NextEra occupies a commanding position within the North American utilities sector distinguished by vertically integrated operations spanning retail electricity sales to end users combined with wholesale generation and transmission ownership [S1]. Its status as a regulated utility imparts revenue stability insulated from typical merchant power market cyclicality – largely due to rate-setting processes that permit recovery of prudently incurred costs plus an authorized ROE.
Within renewables development—an increasingly competitive space—NextEra leverages scale advantages including access to capital markets via NEECH subsidiaries, robust project execution capabilities, extensive interconnection expertise through NEET transmission assets, and proprietary site development knowledge creating barriers for smaller entrants. Furthermore, deep regulatory relationships at the state level facilitate smoother permitting compared to new independent developers.
Competitors are primarily other large regulated utilities alongside independent renewable operators; however, few match NextEra's combined asset scale or geographic diversification concentrated largely in solar-rich southern U.S. states including Florida where FPL dominates the market.
Growth Drivers and Constraints
Growth at NextEra is propelled structurally by multiple converging factors:
- Regulatory Support: FPSC permits timely cost recovery augmented by storm protection clauses stabilizing earnings against weather-related outages.
- Clean Energy Transition: Expansion into solar/wind capacity benefits from federal/state incentives including transferable tax credits enhancing project IRRs.
- Transmission Investment: Ownership of critical NEET line infrastructure exploits growing grid modernization demands aiding renewables integration.
- Stable Retail Base: Florida's growing population underwrites consistent electricity volume increases maintaining FPL’s contribution margin.
- Capital Accessibility: Deep access to bond markets enables funding for capital-intensive projects sustaining long-term expansion strategies.
However, constraints persist:
- Regulatory Risk: Adverse rulings or delayed approvals may curtail rate base growth or defer allowed returns impacting profitability [S1].
- Weather Dependency: Severe hurricanes affecting Florida could increase outage frequency or damage repair costs beyond mitigation plans [S9].
- Commodity Exposure: While diversified, residual exposure to natural gas prices influences marginal generation costs particularly within NEER operations.
- Cybersecurity Threats: Increasing IT system complexity heightens vulnerability to cyberattacks potentially disrupting operations or customer data security [S9].
- Capital Efficiency: The company’s working capital position reflects substantial current liabilities inclusive of accounts payable related to ongoing capital projects, consistent with industry norms for large utilities that operate on tight working capital management practices [F1].
What To Watch Next
Key milestones include:
- Project Completions: Tracking progress on announced renewable capacity builds or transmission expansions critical for sustaining revenue growth.
- Regulatory Filings: Updates related to FPSC rate case decisions or FERC rulings influencing allowed ROEs or cost recovery clauses.
- Renewable Tax Policy Developments: Legislative changes surrounding production tax credits or bonus depreciation impacting project economics.
- Earnings Guidance Revisions: Management commentary during upcoming quarters clarifying trajectory on margins amid inflationary pressures or fuel price movements.
- Capital Markets Access: Monitoring bond issuance activity indicative of funding scales needed for future capex plans.
Financial Profile Overview
Historical performance (annual)
| FY | Net ($bn) | CFO ($bn) | OpInc ($bn) | Capex ($bn) | Net YoY |
|---|---|---|---|---|---|
| 2025 | 6.8 | 12.5 | 8.3 | 7.6 | -1.6% |
| 2024 | 6.9 | 13.3 | 7.5 | 6.8 | -5.0% |
| 2023 | 7.3 | 11.3 | 10.2 | 7.1 | +76.3% |
| 2022 | 4.1 | 8.3 | 4.1 | 6.0 |
Source: SEC companyfacts cache [F1].
Capital returns and efficiency (annual)
| FY | Div ($bn) | FCF ($bn) | ROE% |
|---|---|---|---|
| 2025 | 4.7 | 4.8 | 12.5 |
| 2024 | 4.2 | 6.4 | 13.9 |
| 2023 | 3.8 | 4.2 | 15.4 |
| 2022 | 3.4 | 2.3 | 10.6 |
Source: SEC companyfacts cache [F1].
NextEra ended Q1 2026 with cash and equivalents near $2 billion against total debt approximating $97.8 billion resulting in net debt close to $95.8 billion [F1].
Annualized financial performance exhibits steady operating income growth (+10.7% YoY in latest annual data) although net income declined slightly (-1.6%) relative to prior year likely impacted by one-time costs or tax adjustments [F1]. Operating cash flows remain robust at nearly $12.5 billion enabling coverage of capex exceeding $7.6 billion annually while sustaining dividends now exceeding $4.68 billion per annum [F1]. Equity increased to approximately $54.6 billion supporting a respectable ROE estimate near 12.5% indicative of effective capital deployment respecting regulated returns plus merchant ventures profitability.
This financial profile underscores NextEra’s ability to fund expansive capital programs pivotal to renewable integration initiatives while balancing shareholder return obligations via dividends and moderate share repurchases executed opportunistically during Q1 2026 [S2]. Continued adherence to this disciplined framework will be essential given sizeable leverage metrics coupled with regulatory scrutiny around cost prudence.
Disclaimer: This analysis is based solely on publicly available SEC filings dated up to April 23, 2026, company news releases, and structured financial data without offering any investment advice or recommendations.
Disclaimer: This is research-only, informational analysis and not investment advice. It may include AI-generated interpretation and general industry context. Always verify important details using primary sources.
Comments