
Navios Maritime Partners’ Revenue Stability and Fleet Diversification Bolster 2025 Results
Strong fleet utilization and diversified time charter contracts underpin Navios Maritime Partners’ resilient performance through 2025.
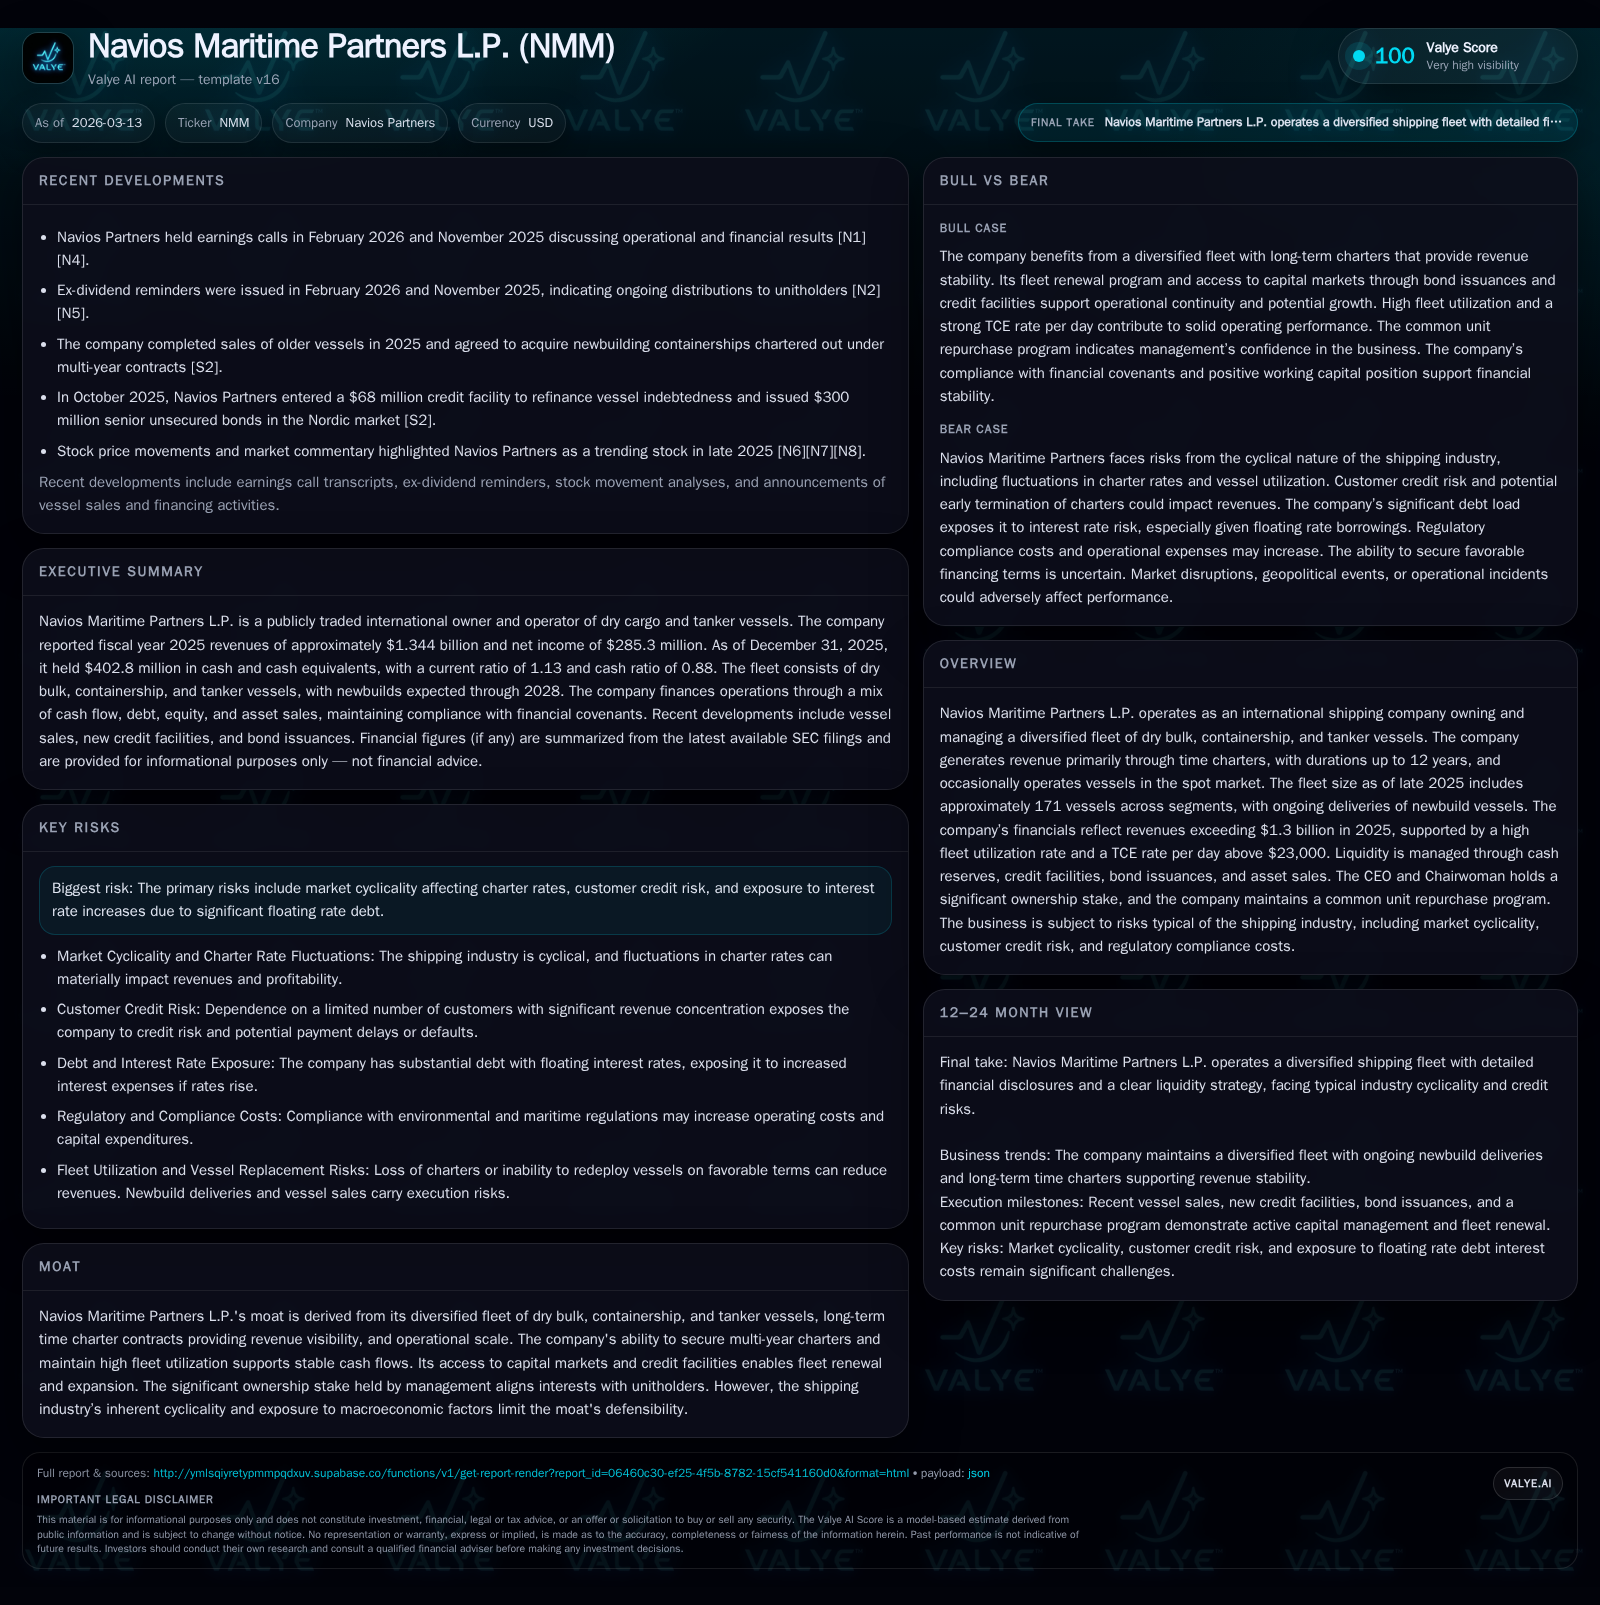
In fiscal 2025, Navios Maritime Partners sustained revenue growth driven by high fleet utilization of 99.2% and a robust Time Charter Equivalent (TCE) rate averaging $23,509 per day. Despite net income declining due to increased depreciation and interest expenses, the partnership maintained strong operating cash flows supported by a diversified fleet across dry bulk, containerships, and tankers. Capital discipline is evident in lower capex spending and prudent liquidity management with compliance on credit covenants and active unit repurchases. Looking forward, the firm’s growth prospects hinge on newbuild deliveries, contract renewals, and market cyclicality impacting charter rates.
Fleet Performance and Revenue Trends in 2025
Navios Maritime Partners posted a marginal revenue increase of 0.8% in 2025, reaching approximately $1.34 billion [F1]. This top-line stability was anchored by exceptionally high fleet utilization, reported at 99.2%, an improvement over the prior year's 98.9% [S1]. The partnership’s ability to secure employment for its vessels nearly throughout the year minimizes off-hire days, a key efficiency metric in shipping operations where available days indicate capacity to generate revenue minus downtime for repairs or ballast transit.
This high utilization coincided with an average Time Charter Equivalent (TCE) rate per day of $23,509 in 2025, up modestly from $22,924 in the prior year [S1]. The TCE metric is industry-standard for measuring daily revenue performance normalized for voyage expenses—providing insight into charter rate strength independent of voyage-specific cost variances. Operating expense per day also rose slightly to $7,009 from $6,829 [S1], reflecting inflationary pressures on crew costs and maintenance.
Overall operating days totaled approximately 53,274 against available days of 53,677—indicating minimal non-revenue-generating periods [S1]. The synergy of fleet utilization metrics alongside steady TCE rates facilitated Navios Partners’ revenue resilience despite a modest contraction in total vessels operated year-end (147 versus 152) potentially linked to fleet renewal activities or asset sales.
Historical performance (annual)
| FY | Rev ($mm) | Net ($mm) | CFO ($mm) | Capex ($mm) | Rev YoY | Net YoY |
|---|---|---|---|---|---|---|
| 2025 | 1344 | 285 | 505 | 28 | +0.8% | -22.3% |
| 2024 | 1334 | 367 | 483 | 28 | +2.1% | -15.3% |
| 2023 | 1307 | 434 | 560 | 183 | +8.0% | -25.1% |
| 2022 | 1211 | 579 | 506 | 434 |
Source: SEC companyfacts cache [F1].
Capital returns and efficiency (annual)
| FY | Div ($mm) | FCF ($mm) | ROE% |
|---|---|---|---|
| 2025 | 6 | 477 | |
| 2024 | 6 | 455 | |
| 2023 | 6 | 377 | 17.0 |
| 2022 | 6 | 73 | 29.4 |
Source: SEC companyfacts cache [F1].
Fleet Composition and Time Charter Contract Strategy
Navios Maritime Partners maintains a diversified fleet of roughly 171 vessels encompassing dry bulk carriers, containerships, and tankers as of late-2025 [N1][S2][F1]. This broad segmentation reduces dependency on any single cargo or market sector—a critical risk mitigation strategy given global seaborne trade volatility.
Long-term time charters dominate revenue streams, with contracts extending up to twelve years at inception [N1][S2]. These multi-year charters offer predictable cash flows insulated from short-term spot market fluctuations—a distinct advantage in an industry characteristically vulnerable to cyclic lows.
The company strategically balances contracted charters with intermittent spot market exposure when vessels await term charters. Continued delivery of newbuild vessels through the first half of the decade suggests active fleet renewal focused on modern tonnage equipped with environmental compliance features like scrubbers [S2]. Such investments aim to enhance operational efficiency and meet tightening IMO emission standards.
Fleet expansion plans include acquisitions aligned with anticipated market demand growth; however, these are cautiously pursued subject to financing availability and favorable contract terms.
Sustaining Profitability: Challenges in Net Income Dynamics
While top-line revenues remained stable through 2025, net income contracted approximately 22% year-over-year to $285 million [F1][S3]. This decrease primarily stems from increased depreciation charges ($349 million versus $292 million prior year), correlating with expanding capital assets such as new vessels treated under U.S. GAAP's amortization policies [F1][S3].
Interest expense rose incrementally to nearly $135 million due chiefly to growing floating-rate debt balances amid rising SOFR benchmarks (average rate reduced from 7.1% in prior periods to approx. 6.3%, but principal borrowings expanded) [S3][S9]. Additionally, Navios recognized heightened other expenses (~$14.7 million) related to foreign exchange claims—an important operational cost source given international transactional exposures under U.S. reporting currency conventions [S3].
Management confirmed no material impairment was required on long-lived assets at year-end based on undiscounted projected cash flows from time charters and fair value assessments despite periodic recoverability tests triggered by vessel sales intentions or market conditions during the year [S1]. This illustrates disciplined asset valuation practices balancing non-cash earnings volatility against cash flow realities.
Earnings quality remains supported by ongoing operational cash generation even as reported accounting income reflects cyclical depreciation cycles plus transient cost fluctuations.
Capital Structure, Liquidity Position, and Debt Management
Navios demonstrated robust liquidity maintaining a current ratio around 1.13 at December 31, 2025 ($512 million current assets vs $455 million current liabilities) [F1][S5]. The company's liquidity is bolstered by cash reserves totaling approximately $403 million alongside undrawn revolver capacity under committed credit facilities [F1][S3][S4].
Indebtedness totaled about $2.16 billion net of deferred finance costs at year-end with comprehensive compliance across restrictive covenants including minimum security coverage ratios (110%-143%), EBITDA-to-interest expense thresholds (minimum 2:1), debt-to-assets limits (<0.80), minimum net worth ($135 million), and debt service coverage above unity [S4][S6]. Such covenants align with standard shipping finance practices ensuring asset-backed credit quality tightly monitored by lenders.
Bond issuances complement revolving bank loans supporting both working capital and capital expenditure financing. The company's access to capital markets enables timely refinancing or incremental borrowings aligned with its strategic expansion or refinancing timelines—critical given volatile freight rate cycles impacting earnings predictability.
Cash deposits exceeding government insurance limits are diversified across major global financial institutions mitigating counterparty risks inherent in treasury management within multinational operations [S3][S14].
Capital Allocation: Cash Flow Returns, Dividends, and Buybacks
Operating Cash Flow increased modestly by 4.4% year-over-year reaching roughly $505 million in FY2025 [F1], reflecting solid core earnings despite accounting headwinds discussed earlier. Correspondingly free cash flow—calculated as Operating Cash Flow less Capex—stands near $322 million attributable to sharply reduced capital expenditure outlays compared with previous years [F1][S16].
Capital expenditures dipped substantially relative to the heightened investment pace in prior periods from over $433 million down to closer to $28 million according to reported figures within the fiscal cycle [F1], illustrating a temporary scaling back perhaps linked with completion stages for newbuild deliveries or recalibrated investment pacing.
Distributions remain conservative relative to cash flow capacity; dividends paid amounted around $6 million annually—a fraction signaling retained earnings reinvestment focus or balance sheet fortification amid cyclical uncertainties [F1][N2].
Since inception of its authorized common unit repurchase program (~$100 million authorization), management executed buybacks totaling approximately $64 million by late November 2025 demonstrating prudent deployment of surplus liquidity aimed at enhancing unitholder returns while retaining flexibility for growth capex if opportunities arise [S19][S21][S24].
Return on equity approximated at a healthy ~11.2% indicating efficient capital utilization balanced against the capital-intensive nature of maritime asset ownership within cyclical commodity markets [F1].
Evaluating Future Growth Drivers and Operational Constraints
Looking ahead, Navios’ growth narrative hinges critically on scheduled vessel acquisitions underpinned by a backlog delivering secured time charter revenues estimated at roughly $3.9 billion as of early Q1-2026 reporting [N1][S2]. This provides significant medium-term visibility although tempered by spot market exposures between charter cycles.
The fleet renewal program continues emphasizing environmentally compliant tonnage aligned with IMO regulations addressing fuel emissions—frontline factors shaping vessel obsolescence risk profiles and charter attractiveness moving forward.
Capital expenditure demands will remain variable given possible fluctuations tied to newbuilding deliveries timing plus discretionary investments into retrofits or scrubbing technology enhancements reflective of evolving regulatory landscapes [N2][S16].
Market cyclicality represents a persistent constraint; macroeconomic drivers influencing seaborne trade volumes and global commodity flux create volatility in charter rates that directly impact earnings sustainability amidst elevated leverage carrying floating interest obligations susceptible to monetary tightening impacts [N2][S14].
Customer credit risk also warrants attention given the concentrated revenue share from key charterers despite robust contract tenure; any unforeseen defaults or renegotiation attempts may impair immediate cash flows requiring proactive mitigants including diversified counterparties and contractual safeguards typically embedded in time charters.
Key Metrics to Monitor: What Comes Next for Navios Partners
Investors should track several operational KPIs indicative of Navios Maritime Partners’ trajectory:
- Trends in TCE rates relative to benchmark indices reflective of dry bulk and tanker charter markets,
- Sustained fleet utilization levels highlighting vessel employment consistency,
- Renewal success rates on expiring multi-year charters mitigating spot rate risks,
- Timing and terms of debt refinancing particularly surrounding bond maturities or syndicate loan facilities,
- Volume and pricing effects stemming from vessel disposal or acquisitions altering cash flow profiles,
- Interest cost evolution tracking SOFR shifts impacting finance expense volatility,
- Capital expenditure plans correlating with newbuild project completions or maintenance deferrals,
- Execution pace on unit repurchases relative to declared authorizations balancing return optimization versus liquidity preservation.
Navigating these metrics will provide insight into how effectively Navios manages intrinsic cyclicality while leveraging its strategic assets for enduring financial resilience.
Disclaimer: This analysis is intended solely for informational purposes using information available as of March 13, 2026. It does not constitute investment advice or recommendations.
Disclaimer: This is research-only, informational analysis and not investment advice. It may include AI-generated interpretation and general industry context. Always verify important details using primary sources.
Comments