
Forrester Research's 2025: From Goodwill Impairment to Cost Restructuring
Forrester Research’s fiscal 2025 reveals a sharp financial downturn driven by a major goodwill impairment and followed by strategic cost-cutting actions amid market headwinds.
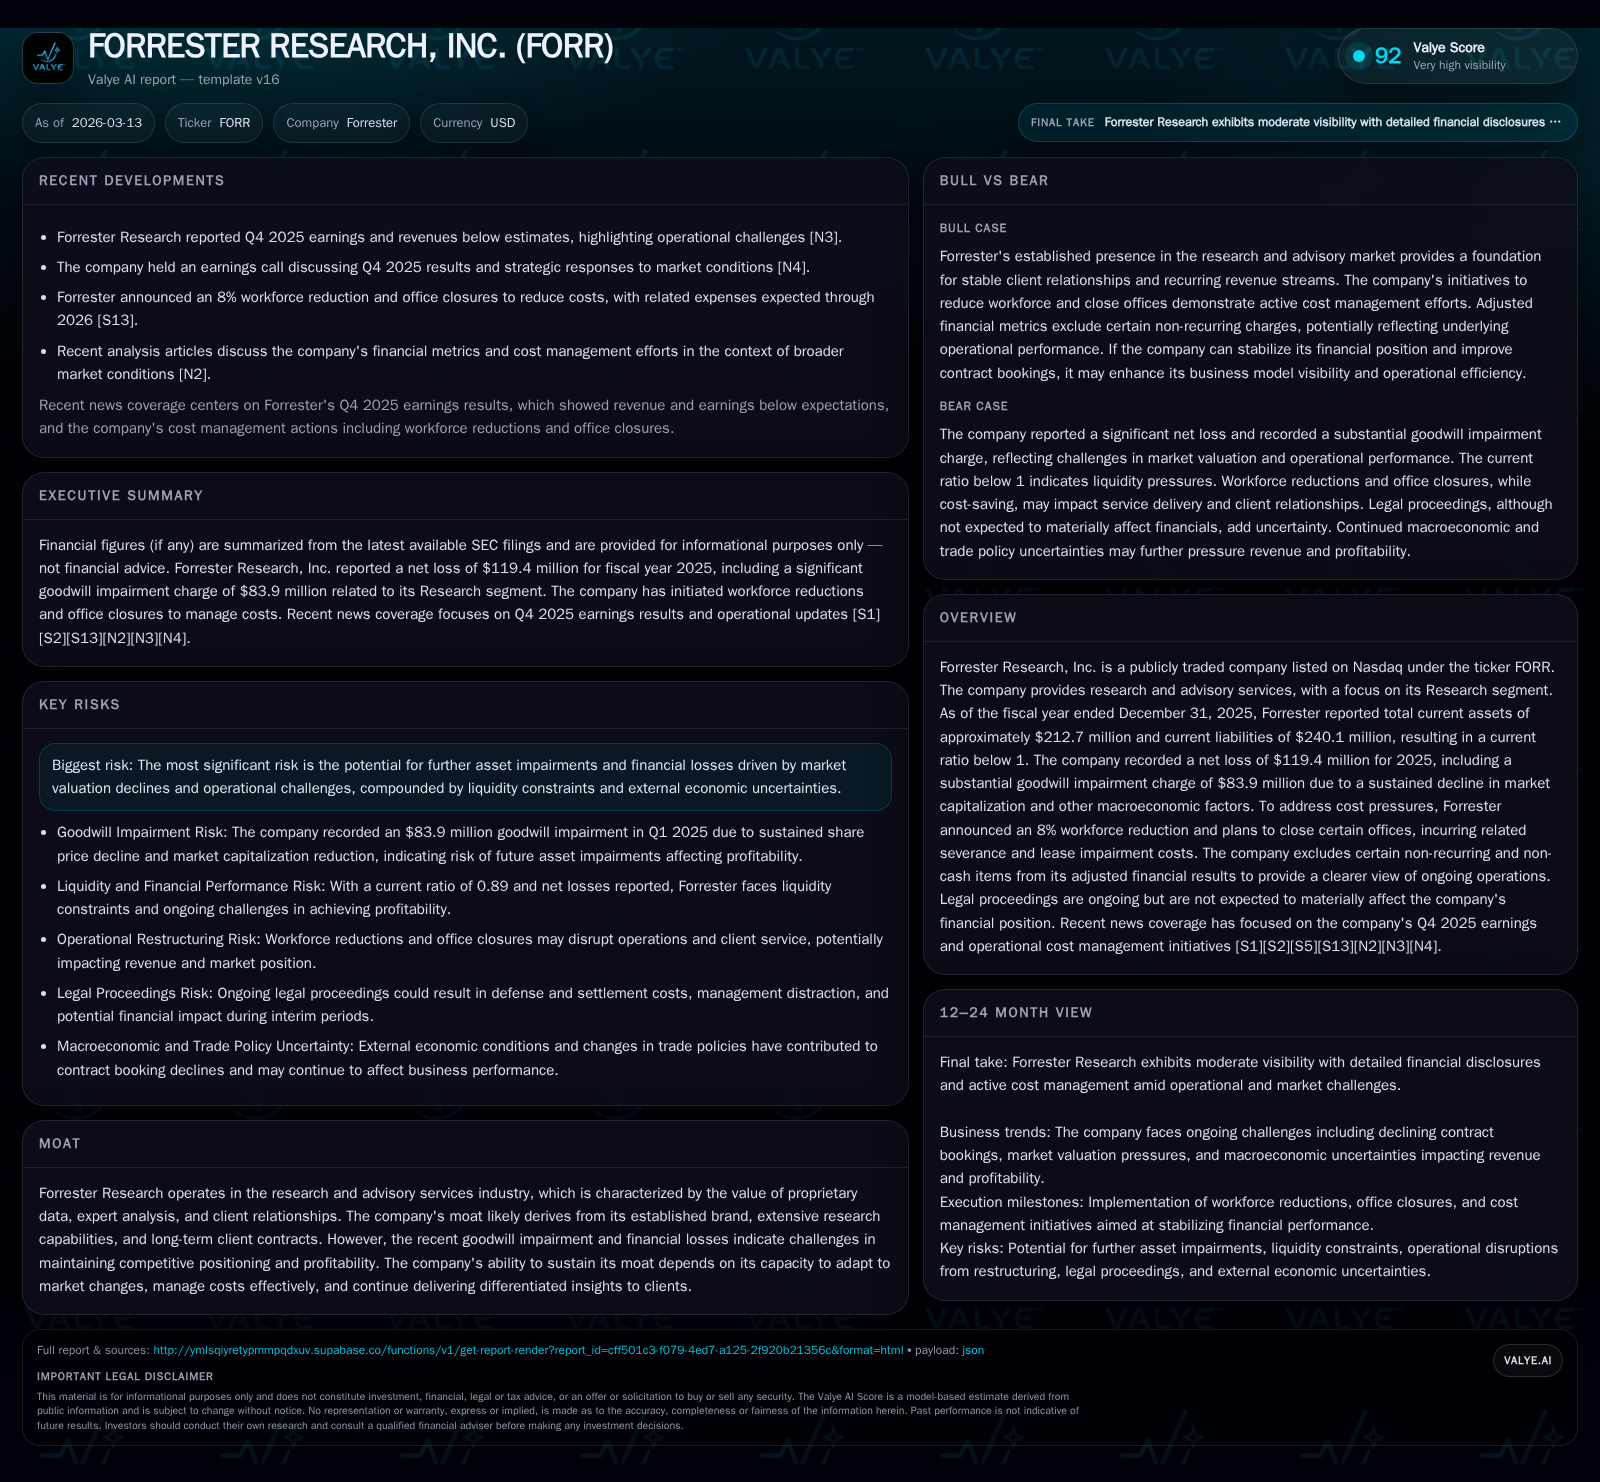
In 2025, Forrester Research faced a severe earnings collapse highlighted by a $83.9 million goodwill impairment triggered by a sustained decline in market capitalization and deteriorating contract bookings. The company responded with an 8% workforce reduction and office closures to control costs, incurring significant severance and lease impairment charges. Despite the net loss of $119.4 million, Forrester maintained positive operating cash flow, signaling operational cash generation amid restructuring efforts. The firm’s competitive moat, based on proprietary research and long-term client relationships, is challenged by evolving market conditions and softness in demand, posing risks to near-term profitability and asset valuations.
Revenue and Earnings Evolution: Dissecting the FY25 Decline
Historical performance (annual)
| FY | Net ($mm) | CFO ($mm) | OpInc ($mm) | Capex ($mm) | Net YoY |
|---|---|---|---|---|---|
| 2025 | -119 | 21 | -113 | 3 | -1976.9% |
| 2024 | -6 | -4 | 1 | 3 | -288.4% |
| 2023 | 3 | 22 | 7 | 5 | -86.0% |
| 2022 | 22 | 39 | 33 | 6 |
Source: SEC companyfacts cache [F1].
Capital returns and efficiency (annual)
| FY | Buybacks ($mm) | FCF ($mm) | ROE% |
|---|---|---|---|
| 2025 | 3 | 18 | -94.3 |
| 2024 | 16 | -7 | -2.5 |
| 2023 | 4 | 16 | 1.3 |
| 2022 | 15 | 34 | 9.8 |
Source: SEC companyfacts cache [F1].
Forrester Research encountered a pronounced downturn in its fiscal 2025 financials, evident in its operating income plunging from a modest positive $0.74 million in FY2024 to a steep loss of $113.2 million [F1]. This translates into an operating income year-over-year decline exceeding -15,300%, underscoring the magnitude of earnings deterioration within just one year. Net income followed a similar trajectory, swinging from a loss of roughly $5.75 million in 2024 to a significantly larger net loss of $119.4 million for FY2025 [F1], representing an almost twentyfold increase in net losses.
Underlying this deterioration were marked reductions in contract bookings starting early 2025 [S2][N2]. Contract bookings — a critical metric signaling future revenue growth in the research advisory business — contracted more than expected during the first quarter, adversely impacting revenue visibility and operating leverage across Forrester’s Research segment [S9]. These booking trends signal lower pipeline momentum ahead, tightening revenue growth prospects.
The company's latest available revenue figure dates from September 30, 2012 at approximately $68.5 million [F1], with no explicit recent revenue disclosure for fiscal 2025.
Goodwill Impairment: Causes and Impact on Financials
A defining event shaping Forrester’s FY25 results was the substantial goodwill impairment charge of $83.9 million recorded during Q1 [S2][S6][F1]. This impairment was prompted by the company’s annual goodwill testing framework compounded by triggering events — namely a sustained decline in share price and overall market capitalization over several weeks between mid-February and March 31, which fell below carrying values.
Additional qualitative factors weighed heavily: adverse macroeconomic conditions affecting client budgets, uncertainties related to U.S. trade policies, and notably diminished contract bookings placing downward pressure on expected future cash flows attributable to reporting units [S7][S2]. Such “impairment triggers” are standard under GAAP for advisory firms that rely on intangible assets like customer relationships embedded in goodwill.
This write-down materially affected reported profitability, inflating net losses while presenting challenges to equity valuation metrics given the revaluation of intangible asset bases.
Operational Response: Workforce Reductions and Office Closures
In response to these financial pressures and declining business momentum, Forrester implemented an aggressive cost rationalization program announced late in 2025 [N1][S20]. This included an approximate 8% reduction in workforce across geographies along with plans to shutter select smaller offices both domestically and internationally.
These actions incurred pre-tax costs estimated between $10 million and $10.5 million primarily due to severance payouts and benefit obligations for the affected employees [S20]. Additionally, closure-related lease impairments were assessed at about $0.4 million non-cash charges alongside roughly $3 million expected contract termination costs tied to exiting office space commitments early [S20].
Such "workforce rationalization" exemplifies sector-specific restructurings aimed at right-sizing operations swiftly amid profit margin contraction while hoping to preserve core research capabilities.
Financial Health Indicators: Liquidity, Cash Flow, and Balance Sheet Stress
At fiscal year-end December 31, 2025, Forrester reported current assets totaling around $212.7 million against current liabilities approximating $240.1 million — yielding a current ratio below unity at roughly 0.89 [F1]. This metric signals potential working capital constraints, implying tighter liquidity conditions that could affect short-term operational flexibility.
Nevertheless, operating cash flow rebounded strongly from negative ($3.86) million in FY24 to positive $21.08 million in FY25 — up over +646% year-over-year — highlighting effective cash management despite reported net losses [F1]. Coupled with relatively controlled capital expenditures declining slightly (~12%) to about $3 million annualized [F1], Forrester posted positive free cash flow exceeding $18 million.
This divergence—the negative accounting profits versus positive cash generation—reflects common dynamics where non-cash charges including impairments inflate losses but underlying operational cash conversion remains intact during restructuring phases.
Capital Allocation Trends: Dividends, Buybacks, and Investment Activity
Amid the structural headwinds and tightened profitability outlooks of FY25, Forrester sharply curtailed its capital return programs as part of disciplined resource allocation efforts.
Buyback activity plummeted from about $15.92 million repurchased shares in FY24 down to merely $2.54 million in FY25 — an over 80% reduction consistent with conserving cash given elevated uncertainties [F1][S13][S14]. There have been no recent declarations or payments of dividends since prior years documented ending 2018; therefore dividend payouts remain dormant currently outside shareholder distribution considerations ([F1]).
Capex trends also reflected caution with investment spending declining moderately year-over-year pointing towards restrained discretionary expenditures amidst cost controls [F1][S19].
Overall capital discipline has become paramount as Forrester balances shrinking equity bases (declined from approximately $229M to about $126M) against maintaining investment into sustaining its core advisory platforms [F1].
Strategic Outlook: Navigating Demand Softness and Market Valuations
Management commentary during Q4 earnings disclosures highlighted ongoing challenges tied directly to weakened contract booking pipelines recognized earlier within the fiscal year [N2][N3][S9]. The softer demand environment constrains growth drivers traditionally fueled by new subscription deals for research services; backlog visibility remains limited given prevailing economic uncertainty.
Further complicating prospects are competitive pressures from both established consulting firms expanding digital data analytics offerings and emerging AI-driven insights platforms reshaping client expectations across sectors — thus compression risk on pricing power looms large.
Forward-looking guidance remains cautious with explicit quantification absent; stakeholders are advised instead to track quarterly booking cadence closely as an early warning mechanism for recovery or continued softness [S10].
Moat Sustainability: Risks and Competitive Positioning Amid Headwinds
The core of Forrester’s competitive advantage lies in its proprietary datasets combined with expert analyst insights leveraged through long-standing customer contracts—a moat insulated somewhat from commoditized market offerings [S4][S8]. Nonetheless, this moat faces erosion risks given weakening financial performance flagged by sizable impairments coupled with external pressures such as evolving client needs shifting towards integrated technology solutions.
Brand strength offers resilience but sustaining differentiation demands continued innovation investments which could be constrained amid present cost retrenchments. Additionally, legal contingencies acknowledged remain manageable but represent latent risk points that could affect episodic interim earnings volatility though with no material anticipated impact presently [S4].
Monitoring Key Milestones: What Investors Should Watch Next
Key upcoming metrics warranting close monitoring include initial quarter (Q1) booking performance beating or missing estimates as these directly inform forward revenue recognition under subscription models [N1][N2]. Any signs of reacceleration or stabilization would underpin confidence around injury reversal through operating leverage benefits.
Furthermore, attention should be paid for potential announcements related to further impairments or expanded restructuring initiatives stemming from incremental operational reviews made public alongside quarterly reports especially given near-term macroeconomic unpredictability [N3][S3][S9].
Liquidity metrics such as current ratio movement alongside free cash flow maintenance will signal whether working capital management continues apace without raising refinancing concerns.
Disclaimer: This analysis is based solely on publicly available information up to March 13, 2026, including SEC filings and reputable financial news sources cited herein. It is intended purely for informational purposes without offering investment advice or recommendations.
Disclaimer: This is research-only, informational analysis and not investment advice. It may include AI-generated interpretation and general industry context. Always verify important details using primary sources.
Comments