
RideNow Group’s Strategic Focus on Powersports Retail Amid Refinancing and Inventory Challenges
Following the exit from vehicle transportation services, RideNow concentrates on growing its powersports dealership network while managing debt maturities and operational margins.
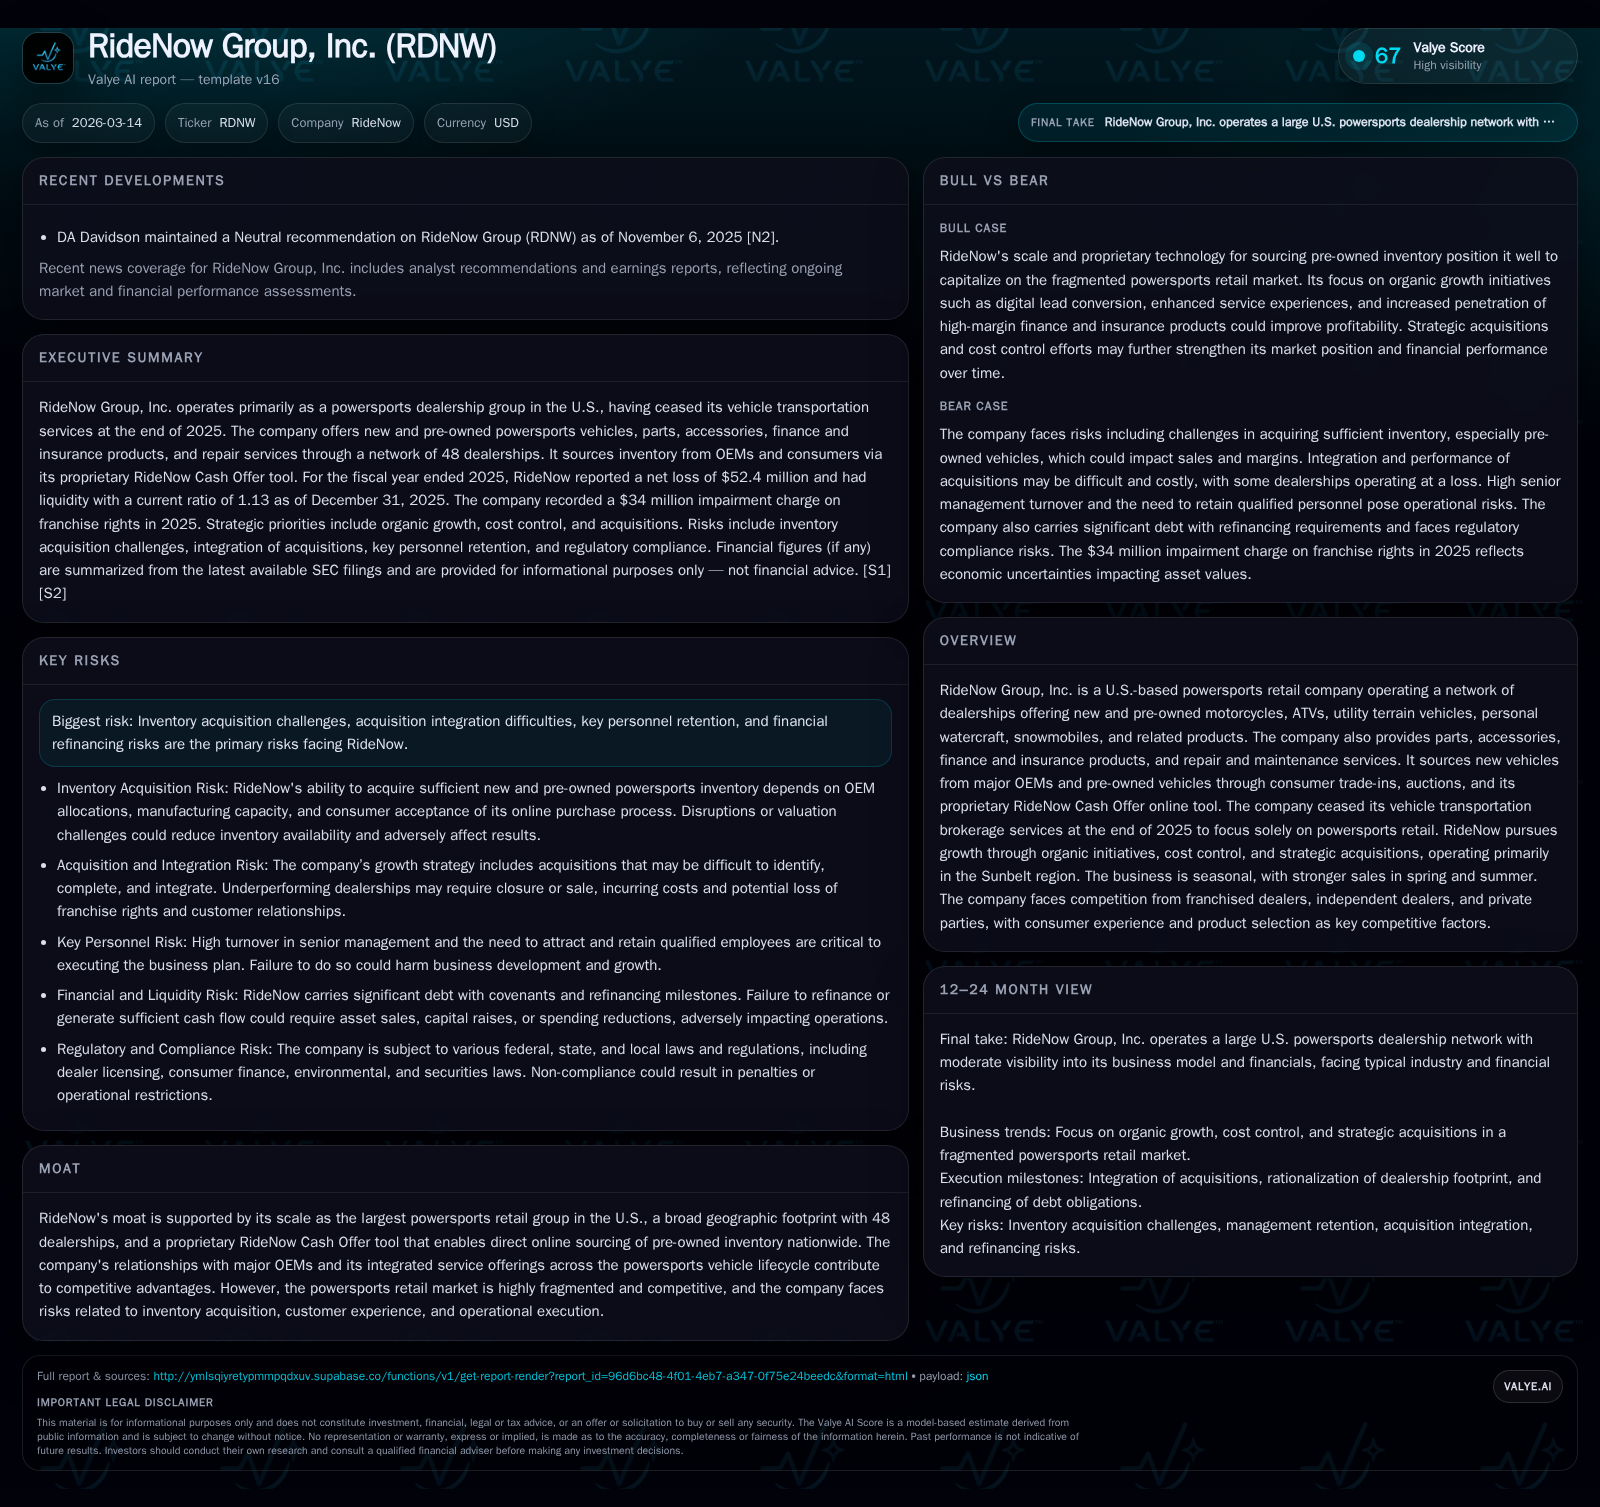
RideNow Group, Inc. has transitioned to focus exclusively on its powersports retail business, operating 48 dealerships mainly across the Sunbelt states. The company’s growth since 2013 has been largely acquisition-driven, expanding its footprint and revenue base significantly. Despite strong historical revenue growth, profitability remains challenged with operating losses narrowing only recently. Key operational drivers include the mix of new versus pre-owned vehicle sales and the proprietary RideNow Cash Offer platform for sourcing pre-owned inventory. Financially, the company carries substantial debt with a term loan due in 2027 requiring refinancing efforts underway. Operating cash flow turned positive in 2025, supported by cost controls and inventory management, while capital expenditures remain modest. Competitive pressures and refinancing risks are key considerations going forward.
Company Overview and Historical Performance
RideNow Group, Inc., headquartered in Chandler, Arizona, is recognized as the largest powersports retail group in the United States with a portfolio spanning new and pre-owned motorcycles, ATVs, side-by-side vehicles (SXS), personal watercraft (PWC), snowmobiles, and aftermarket parts/accessories. Incorporated in 2013 and public since 2017 (ticker RDNW), RideNow’s growth has been largely acquisition-driven expanding its dealership footprint predominantly in Sunbelt states [S1].
The company reported substantial revenue scale-up from $840.6 million in 2019 to $938.4 million in 2021, then nearly doubling to $1.79 billion in 2022 primarily through acquisitions [F1]. Despite this top-line growth, operating losses persisted until narrowing significantly by fiscal year-end 2025.
Historical performance (annual)
| FY | Net ($mm) | CFO ($mm) | OpInc ($mm) | Capex ($mm) | Net YoY |
|---|---|---|---|---|---|
| 2025 | -52 | 16 | 0 | 6 | +33.3% |
| 2024 | -79 | -15 | 2 | +63.5% | |
| 2023 | -215 | -69 | 14 | +17.6% | |
| 2022 | -262 | -19 | -287 | 6 |
Source: SEC companyfacts cache [F1].
Capital returns and efficiency (annual)
| FY | FCF ($mm) | ROE% |
|---|---|---|
| 2025 | 10 | 419.2 |
| 2024 | -214.2 | |
| 2023 | -204.1 | |
| 2022 | -25 | -126.9 |
Source: SEC companyfacts cache [F1].
Source: Consolidated financial summaries based on SEC filings and XBRL data [F1]
Strategic Shift: Exit from Vehicle Transportation Services
Previously operating two segments—powersports dealerships and vehicle transportation brokerage—the company ceased its asset-light freight brokerage business at the end of December 2025 to concentrate fully on its core powersports retail operations [S1]. This streamlines focus but reduces diversification.
Powersports Retail Operations: Scale and Competitive Positioning
As of December 31, 2025, RideNow operated 48 dealerships across multiple states including Arizona, Florida, Texas among others mainly within the Sunbelt region [S1]. Inventory sourcing includes direct procurement of new units from major OEMs such as Polaris, Harley-Davidson Yamaha Kawasaki and BRP under standard dealer agreements.
Pre-owned inventory is acquired via trade-ins at dealerships and auctions but notably also through the proprietary RideNow Cash Offer technology enabling direct consumer purchases nationwide—this digital tool is a competitive advantage for timely access to quality pre-owned units [S1][S21].
Competition remains intense from franchised dealers with exclusive OEM relationships as well as independent dealers and private sellers both offline and online. The fragmented nature of the market coupled with low entry barriers for digital marketplaces presents ongoing challenges for pricing power and inventory acquisition [S21].
Financial Performance Drivers: Unit Economics and Margin Trends
Revenue comprises sales of new and pre-owned powersports vehicles plus ancillary finance & insurance (F&I) products as well as parts/service/accessories (PSA). Gross profit per unit varies by mix:
- Retail sales generally yield higher margins than wholesale channels.
- Pre-owned vehicles sold retail typically generate better margins than wholesale sales.
- F&I products add incremental margin streams.
Gross profit fluctuations arise from vehicle mix shifts between new vs pre-owned units; channel distribution; pricing strategy; inventory sourcing costs; and average days-to-sale influencing holding costs [S4][S5][S19].
Recent quarterly data showed a slight decline in powersports vehicle revenues (-1% YoY Q3) balanced by growth in parts/service/accessories (+3.3%), resulting in a modest gross profit increase (+13% YoY Q3), supported by improved margin management despite volume softness [S19]. Per-unit gross profit increased for both new (+$132 Q3 YoY) and pre-owned (+$183 Q3 YoY) vehicles indicating effective pricing or cost control measures offsetting volume headwinds [S26].
Seasonality Effects
Demand shows seasonal patterns aligned with warmer months favoring recreational vehicle purchases; colder quarters typically see lower sales volumes impacting fourth quarter results relative to earlier periods [S1].
Liquidity Profile and Capital Structure
As of December 31, 2025 RideNow held approximately $29.5 million in cash & equivalents against current liabilities near $296.5 million yielding a current ratio around 1.13x indicating modest liquidity cushion. Total debt stood near $443 million composed mainly of:
- Floor plan notes financing inventory (~$235 million)
- Term loan facility (~$209 million)
- Subordinated loans (~$10 million) plus minor other borrowings [F1][S6][S10][S25]
The term loan matures September 2027 with credit covenants requiring refinancing commencement by September 30th, 2026 and completion by November-end or risk default triggering acceleration clauses [S6][S10][S12][S25]. Amendment No.10 extended facility maturity from August 2026 to September 30th next year alongside mandatory principal prepayment ($20 million) funded partly via subordinated loans bearing high interest (~13%) underscoring refinancing pressures [S6][S11][S17][S23].
Operating cash flow improved to positive $15.9 million for fiscal year ended December 31, 2025 after prior losses driven by tighter cost controls including SG&A reductions (-12% YoY), better inventory management reducing holding costs plus margin improvements per unit sold [F1][S12][S16]. Capital expenditures were controlled at $5.6 million supporting maintenance capex across dealership infrastructure [F1].
Outlook: Growth Opportunities and Risks
Growth Catalysts:
- Leveraging proprietary RideNow Cash Offer platform to enhance quality pre-owned vehicle sourcing nationwide could improve margins.
- Potential consolidation within fragmented powersports dealer market aligning with RideNow’s acquisition track record may drive scale benefits.
- Enhancements across customer experience lifecycle—from sales through service—could boost brand loyalty amid competition.
- Geographic expansion deeper into populous Sunbelt markets or select new regions may foster incremental volume growth if matched by operational execution.
Risks:
- Inventory sourcing constraints amid competitive OEM supply conditions could pressure vehicle availability.
- Integration risks associated with acquisitions potentially diluting expected synergies.
- Retention of key personnel incentivized as owners critical for dealership performance.
- Refinancing risk given large debt maturities coupled with uncertain capital markets conditions could limit financial flexibility.
- Competitive pressures not only from traditional dealerships but also aggressive digital marketplaces may compress margins further.
- Regulatory compliance costs related to finance product offerings and environmental regulations could increase operating expenses [S9][S27].
Key Near-Term Milestones to Monitor
- Completion of required refinancing for term loan before November 30th, 2026 deadline per credit agreement covenants.
- Stability or improvement in retail unit sales volumes alongside sustained gross profit per unit gains signaling pricing power.
- Progress on acquisition integration reflected through improving operating income or EBITDA metrics if reported.
- Expansion or refinement of RideNow Cash Offer platform usage unlocking additional pre-owned sourcing advantages.
- Working capital management effectiveness particularly managing inventory days given seasonal demand fluctuations.
This analysis is based solely on publicly available disclosures through March 2026 without any investment advice or recommendations.
Disclaimer: This is research-only, informational analysis and not investment advice. It may include AI-generated interpretation and general industry context. Always verify important details using primary sources.
Comments