
Studio City International Holdings Reports Revenue Growth Amid Operating Improvements and Ongoing Net Losses in 2025
Studio City International Holdings posted revenue growth and improved operating income in 2025, while continuing to face net losses and liquidity pressures amid a complex regulatory environment.
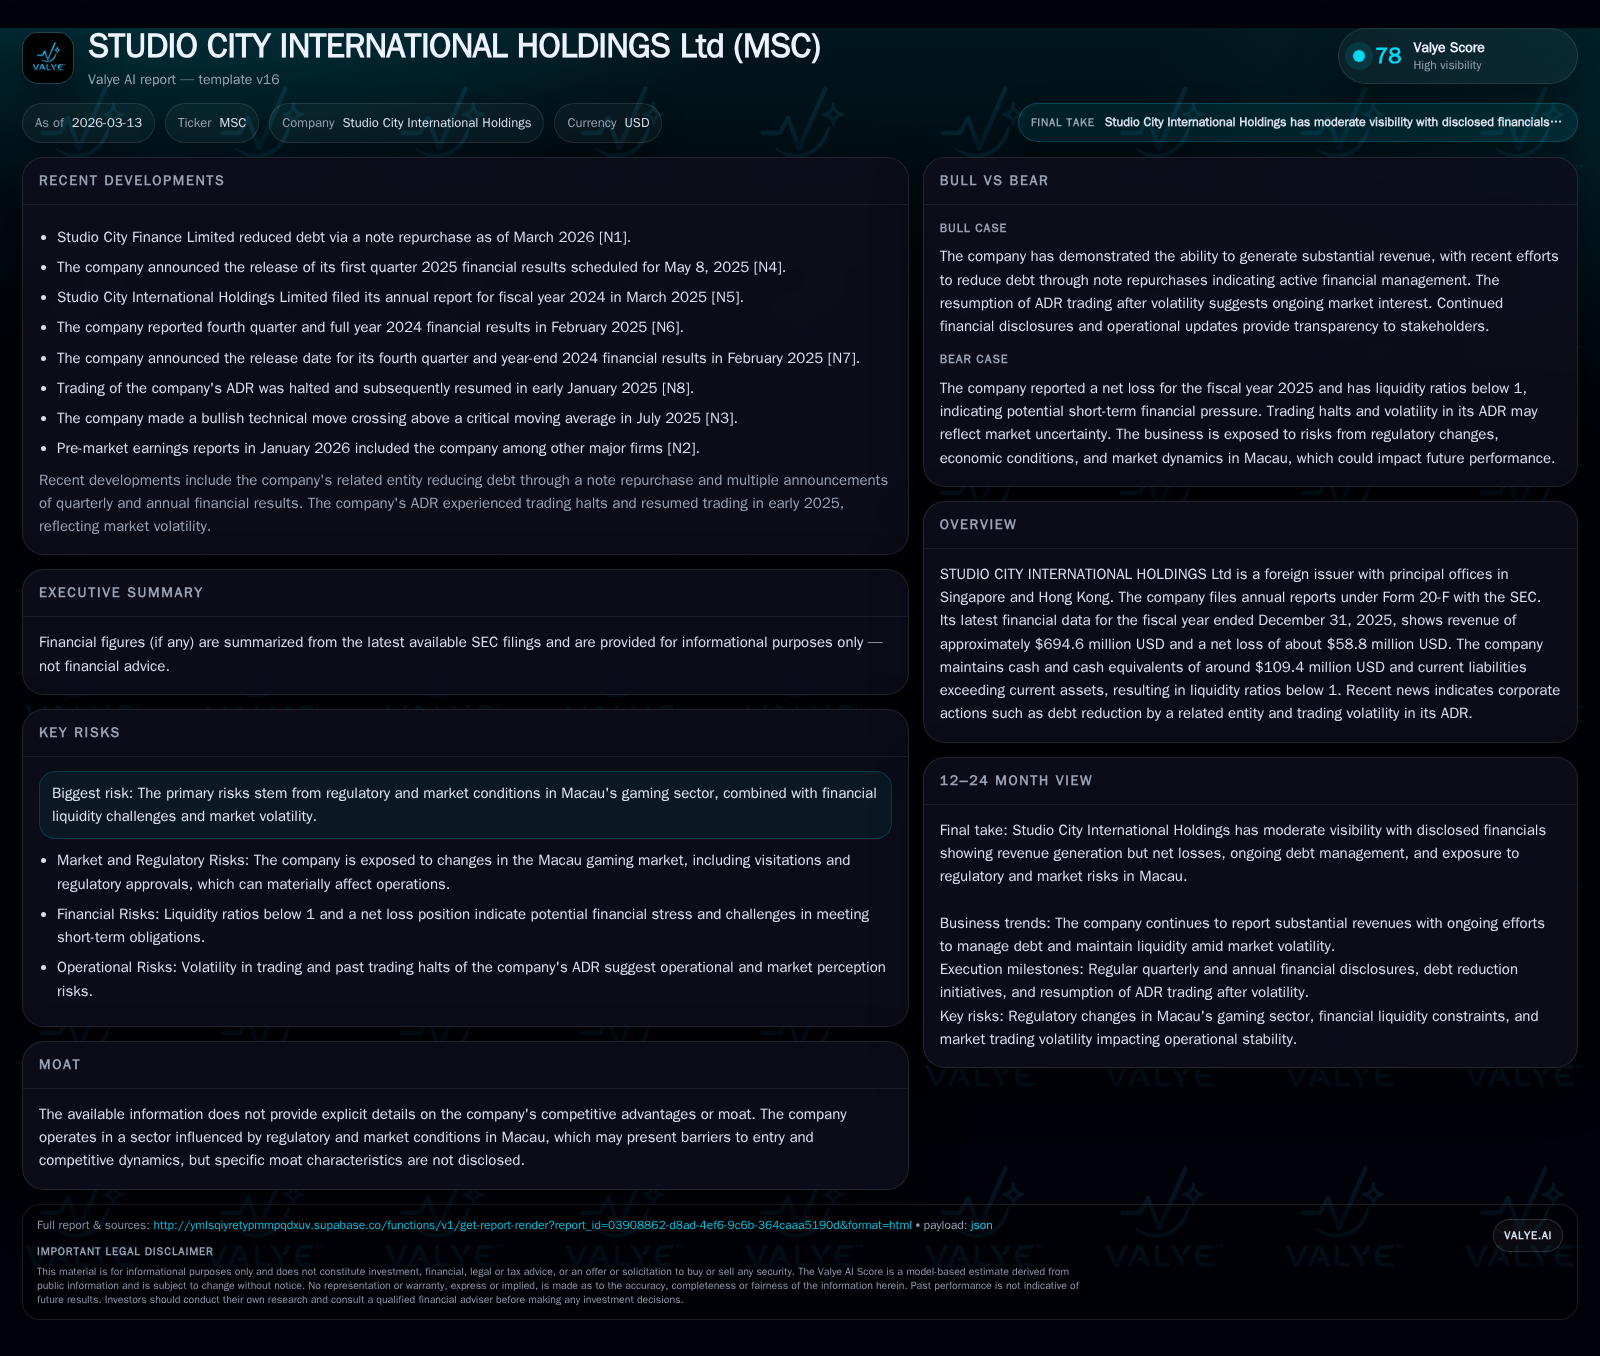
In fiscal 2025, Studio City International Holdings achieved revenue of $694.6 million, an 8.7% increase over the prior year, supported by recovery in Macau’s gaming market [F1]. Operating income rose sharply by 83.6% to $70.0 million, reflecting improved operational efficiency [F1]. Despite this progress, the company recorded a net loss of $58.8 million due to significant interest expenses and financing costs [F1][N2]. Liquidity remains constrained with a current ratio of approximately 0.73 and cash reserves of $109.4 million at year-end [F1]. Studio City Finance Limited’s recent debt repurchase activity signals ongoing balance sheet management efforts [N2]. The company has not paid dividends from 2022 through 2025, indicating a focus on reinvestment or deleveraging strategies amid regulatory uncertainties impacting Macau’s gaming sector [S4-S11].
Revenue Growth Reflects Macau Market Recovery
Studio City International Holdings Ltd (MSC) reported revenue of approximately $694.6 million for fiscal year 2025, up 8.7% from $639.1 million in 2024 [F1]. This growth continues the recovery trajectory following pandemic-related disruptions that heavily impacted Macau's gaming sector.
The increase reflects improving visitor volumes and spending patterns in Macau's integrated resorts where MSC operates.
Operating Income Improvement Driven by Efficiency Gains
Operating income for 2025 rose significantly by 83.6% to about $70.0 million compared to $38.1 million in the prior year [F1]. This turnaround follows operating losses in previous years (-$29.0 million in 2023 and -$277.2 million in 2022), indicating that MSC is benefiting from operational leverage as casino operations normalize.
Cost management initiatives alongside stronger gaming demand contributed to margin expansion.
Net Losses Continue during Elevated Financing Costs
Despite operational improvements, MSC reported a net loss of approximately -$58.8 million in 2025, an improvement from -$96.7 million in 2024 [F1]. The continued losses are primarily attributable to high interest expense and other non-operating financial charges typical for capital-intensive casino operations [N2][F1].
Liquidity Position Shows Constraints
At fiscal year-end, MSC held cash and equivalents of around $109.4 million but had current liabilities exceeding current assets, resulting in a current ratio of approximately 0.73 [F1]. This indicates working capital pressures requiring careful short-term liquidity management.
Debt Reduction Efforts by Affiliate Entity
Studio City Finance Limited, an affiliated entity within the group's structure, recently undertook note repurchases aimed at reducing debt levels [N2]. This reflects active balance sheet management efforts during fluctuating credit market conditions.
Capital Allocation Focus: No Dividends; Reinvestment Priority
Review of multiple SEC filings confirms that MSC has not paid dividends from at least fiscal years 2022 through 2025 . This aligns with a strategy prioritizing reinvestment and deleveraging over shareholder distributions.
No significant share repurchase programs have been disclosed during this period.
Outlook Considerations: Regulatory Environment and Market Dynamics
Ongoing regulatory developments in Macau's gaming legislation remain a key uncertainty impacting visitation trends and licensing frameworks for MSC's operations [S5].
Market volatility also affects refinancing opportunities and capital costs across the sector.
Financial Performance Summary Table (USD Millions)
Historical performance (annual)
| FY | Rev ($mm) | Net ($mm) | CFO ($mm) | OpInc ($mm) | Rev YoY | Net YoY |
|---|---|---|---|---|---|---|
| 2025 | 695 | -59 | 210 | 70 | +8.7% | +39.2% |
| 2024 | 639 | -97 | 190 | 38 | +43.5% | +27.6% |
| 2023 | 446 | -134 | -19 | -29 | +3758.1% | +59.1% |
| 2022 | 12 | -326 | -179 | -277 |
Source: SEC companyfacts cache [F1].
Capital returns and efficiency (annual)
| FY | Div | ROE% |
|---|---|---|
| 2025 | 0 | -11.2 |
| 2024 | 0 | -16.4 |
| 2023 | 0 | -20.0 |
| 2022 | 0 | -40.8 |
Source: SEC companyfacts cache [F1].
This report is based on publicly available information as of the latest filing dates without providing investment advice or recommendations.
Disclaimer: This is research-only, informational analysis and not investment advice. It may include AI-generated interpretation and general industry context. Always verify important details using primary sources.
Comments