
Norwood Financial Corp’s Rebound: From Turnaround in 2024 to Strengthened Dividend Profile
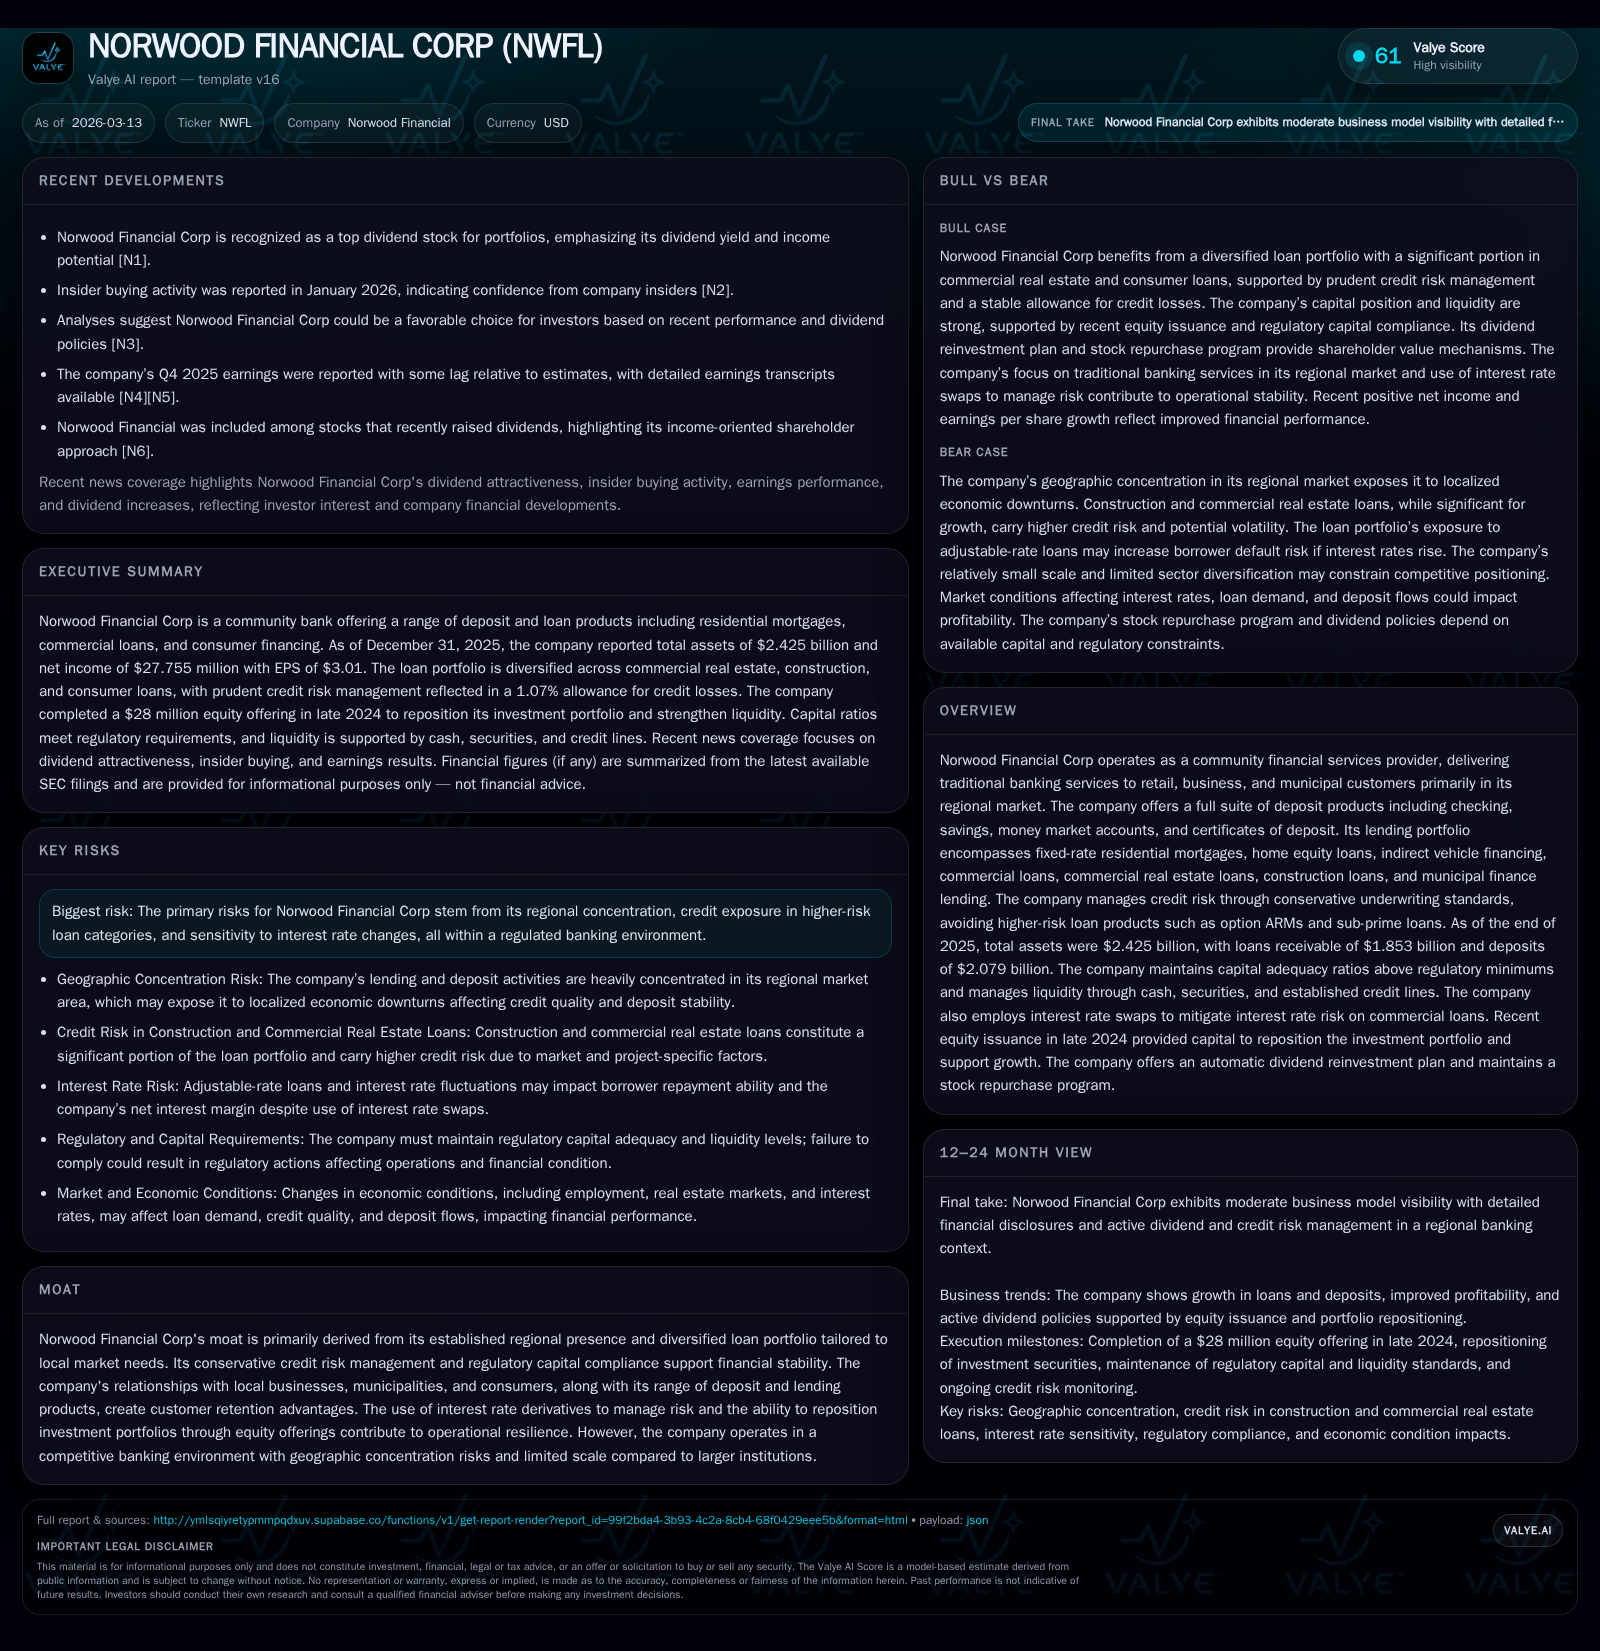
Norwood Financial Corp transitioned from a near breakeven 2024 to solid profitability in 2025, driven by strategic capital actions and disciplined portfolio management.
In 2025, Norwood Financial Corp delivered a robust net income of $27.8 million following a marginal loss of $160K in 2024, underscoring a significant financial turnaround. This shift was anchored by a December 2024 equity raise, repositioning of investment securities to higher yields, and measured loan portfolio growth with conservative credit standards. Enhanced liquidity and prudent capital allocation facilitated increased dividends and modest share repurchases, reflecting confidence in cash flow sustainability amid regional market concentration risks. Key focus areas ahead include maintaining credit quality through diversified lending and navigating regional economic dynamics.
From Challenging 2024 Losses to a Strong Earnings Recovery in 2025
Historical performance (annual)
| FY | Net ($mm) | CFO ($mm) | Capex ($mm) | Net YoY |
|---|---|---|---|---|
| 2025 | 28 | 34 | 5 | +17446.9% |
| 2024 | 0 | 23 | 3 | -101.0% |
| 2023 | 17 | 30 | 1 | -42.7% |
| 2022 | 29 | 31 | 2 |
Source: SEC companyfacts cache [F1].
Capital returns and efficiency (annual)
| FY | Div ($mm) | Buybacks ($mm) | FCF ($mm) |
|---|---|---|---|
| 2025 | 11 | 0 | 29 |
| 2024 | 10 | 1 | 20 |
| 2023 | 9 | 3 | 28 |
| 2022 | 9 | 3 | 29 |
Source: SEC companyfacts cache [F1].
Norwood Financial Corp marked a decisive turnaround in its financial performance from the prior year. The company's net income leapt from a minor loss of $160,000 in FY2024 to an impressive $27.8 million profit in FY2025 [F1]. This dramatic recovery was powered largely by two critical corporate actions in late 2024 reported in the company's annual filings [S1]. First, an underwritten public offering raised approximately $28 million via issuance of 1.15 million shares at $26 each. This fresh equity bolstered Norwood's capital base importantly for liquidity support and future growth funding.
Concurrently, the company repositioned its debt securities portfolio by divesting approximately $175 million of available-for-sale bonds generating an approximate pre-tax loss of $20 million [S1], principally due to yield curve shifts rather than credit impairments [S5]. The proceeds were reinvested into higher yielding bonds averaging around 5.17%, compared to the disposed portfolio yielding just below 2% on average [S1][S5]. This repositioning strategically enhanced forthcoming interest income streams while strengthening the balance sheet's resilience against rising rates.
Loan Portfolio Expansion and Conservative Credit Management Underpin Growth
The company expanded its loan portfolio significantly during the year with total loans receivable climbing by about $139.8 million to $1.853 billion at year-end 2025 [F1][S7]. Key contributors included a $42.6 million increase in consumer loans—largely comprising indirect vehicle financing through affiliated dealers—as well as increases of $33.4 million and $32.4 million respectively within commercial real estate and construction loans [S7]. While this expansion reflects improved demand and origination execution, underwriting rigorousness remains intact; Norwood avoids high-risk categories such as option ARMs or subprime lending and maintains disciplined collateralization standards including owner occupancy requirements for commercial properties [S6][S16].
Commercial real estate loans represented 40.5% of total loans outstanding amounting to over $750 million with non-owner occupied segments limited to roughly 10%, which aligns conservatively with regulatory guidance dependent on tier 1 capital plus allowances for credit losses thresholds [S6]. Construction loans stood at approximately $85 million or about 4.6% of total loans outstanding—a figure actively monitored against the company's internal risk appetite metrics.
Credit quality measures reinforce this prudence; allowance for credit losses marginally increased but practically maintained at around 1.07% of total loans with net charge-offs remaining very low at just over 0.11% of average loans in FY2025 [S12].
Repositioning Investment Securities Elevates Interest Income Potential
The December 2024 sell-down of lower-yielding available-for-sale securities at a reported pre-tax loss represented a deliberate tactical choice intending to boost long-term profitability rather than signal distress [S1][S5]. The subsequent reinvestment targeted holdings with materially higher yields over the displaced portfolio—approximately tripling the yield from ~2% to over 5% on new acquisitions—thus amplifying the Company's ability to generate net interest income amid prevailing rate environments.
This approach is consistent with community banking asset/liability management principles which balance duration risk while preserving liquidity for loan growth and deposit obligations . Notably, unrealized losses totaling about $30.7 million at year-end were attributed primarily to interest rate moves post-acquisition and not taken as indicators of credit impairment [S5][S28].
Liquidity Improvements and Capital Structure Adjustments Support Stability
Liquidity rose modestly from approximately $161.5 million (7% of assets) at December 31, 2024 to $190.8 million (7.9% of assets) by end-2025 due to increases in cash equivalents coupled with non-pledged available-for-sale securities totaling about $146 million [S4][F1]. The bank also maintained access through well-established lines of credit totaling nearly $169 million across the Federal Reserve Bank, Federal Home Loan Bank (FHLB), Atlantic Community Bankers Bank (ACBB), and PNC Bank facilities [S4][S7]. Outstanding borrowings on these lines notably decreased from prior-year levels reflecting better intrinsic liquidity generation.
Total assets grew by roughly $107 million mainly reflecting loan growth offset slightly by lower cash balances [S7]. Regulatory capital ratios underscore balance sheet strength; total capital was about $254 million or approximately 13.41% of risk-weighted assets while Tier 1 capital stood near $234 million representing a healthy Tier 1 ratio above regulatory minima at about 12.37% [S22]. These figures indicate substantial cushion supporting ongoing operations and planned growth initiatives.
Borrowings from FHLB decreased significantly as Norwood made full repayments on term borrowings from Federal Reserve Bank programs during late 2024/early 2025 culminating in improved funding cost profiles [S5][S25].
Dividend Policy and Share Repurchases Reflect Confidence in Cash Flow
Capital allocation decisions reflect prudent but progressive shareholder returns matched to improved earnings power. Dividends paid increased year-over-year from nearly $9.72 million in FY2024 to about $11.49 million in FY2025 consistent with raising the quarterly dividend per share from previous levels up to an annual rate of approximately $1.25 per share [F1][S8][N1][N2]. The Company’s return on equity stands near an approximate 11.5% for FY2025 based on net income and shareholders' equity teardown—offering meaningful coverage for dividend policy continuity [F1].
Share repurchases remain minimal recently with only about $361K expended on buybacks during FY2025 contrasted against prior more active repurchase years [F1][S8]. This restrained buyback activity aligns with cautious capital stewardship prioritizing liquidity preservation amid elevated macroeconomic uncertainties.
An Automatic Dividend Reinvestment Plan furthers shareholder engagement by allowing reinvestment without transaction costs; participants may also purchase additional shares voluntarily supporting stable equity breadth [S8].
Risk Concentrations and Regional Market Dynamics to Monitor Ahead
Operational risks primarily stem from Norwood’s concentrated geographic footprint servicing Northeastern Pennsylvania and parts of New York encompassing counties such as Wayne, Pike, Luzerne, Delaware, Sullivan among others [S6][S13]. While no single industry exceeds more than approximately 10% loan concentration thresholds reducing sector-specific vulnerability, regional economic forces remain influential over borrower performance.
Concentrations are particularly notable within commercial rentals ($179 million) and hotel/motel sectors ($125 million). Despite these exposures being sizable portions within respective portfolios, historical charge-offs have been negligible evidencing effective underwriting controls so far [S6]. Moreover, municipal lending involves carefully reviewed general obligations secured by taxing authorities or revenue-producing projects—seen as lower credit risk relative to commercial unsecured categories [S16][S20].
Additionally, Norwood utilizes interest rate swap agreements facilitating customers' conversion of variable-rate commercial loans into effectively fixed-rate instruments while economically hedging these exposures—a technique designed not for speculative gain but risk mitigation consistent with banking best practices [S10]. Changes in rates do not impact earnings materially due to offsetting swap positions providing financial stability within variable-rate exposures.
Key Upcoming Milestones and Strategic Imperatives for Growth
Looking forward, key operational milestones encompass quarterly earnings releases that will reveal whether sustained loan growth momentum endures alongside asset quality maintenance amidst tightening economic conditions [N3][N4]. Investors should monitor liquidity trends relative to deposit behaviors particularly concerning uninsured deposits which represent an elevated risk segment albeit managed through bid-based jumbo CD pricing strategies targeting municipalities [S18][S27].
Technology adoption including enhanced digital services such as mobile deposit capture and Zelle payment integrations bolster customer retention while expanding transactional revenue streams reflecting evolving client expectations within community banking domains .[N1]
Dividend sustainability anchored by cash flow dynamics will remain a focal area—as free cash flow after capital expenditures stood robustly positive near ~$29 million for FY2025—providing flexibility despite macroeconomic uncertainty [F1]. Concurrently, competitive pressures stemming from larger regional banks may necessitate nimble product offerings or targeted expansions potentially broadening service reach beyond current geographic confines.
This review synthesizes Norwood Financial Corp’s most recent disclosures emphasizing verifiable results without extrapolation beyond sourced data points or speculative commentary regarding future outcomes. The firm’s measured rebound from near breakeven operations combined with strengthened liquidity and calibrated capital allocations signals effective management execution within its regional banking niche.
This report is provided solely for informational purposes without any recommendation regarding investment decisions.
Disclaimer: This is research-only, informational analysis and not investment advice. It may include AI-generated interpretation and general industry context. Always verify important details using primary sources.
Comments