
Northern Oil & Gas Advances Production 9% in Q2 2026 Supported by Acquisitions and Partner-Driven Growth
Northern Oil & Gas expanded its non-operated asset portfolio across key North American basins, leveraging acquisitions and operator activity to grow production while managing commodity price exposure through hedging.
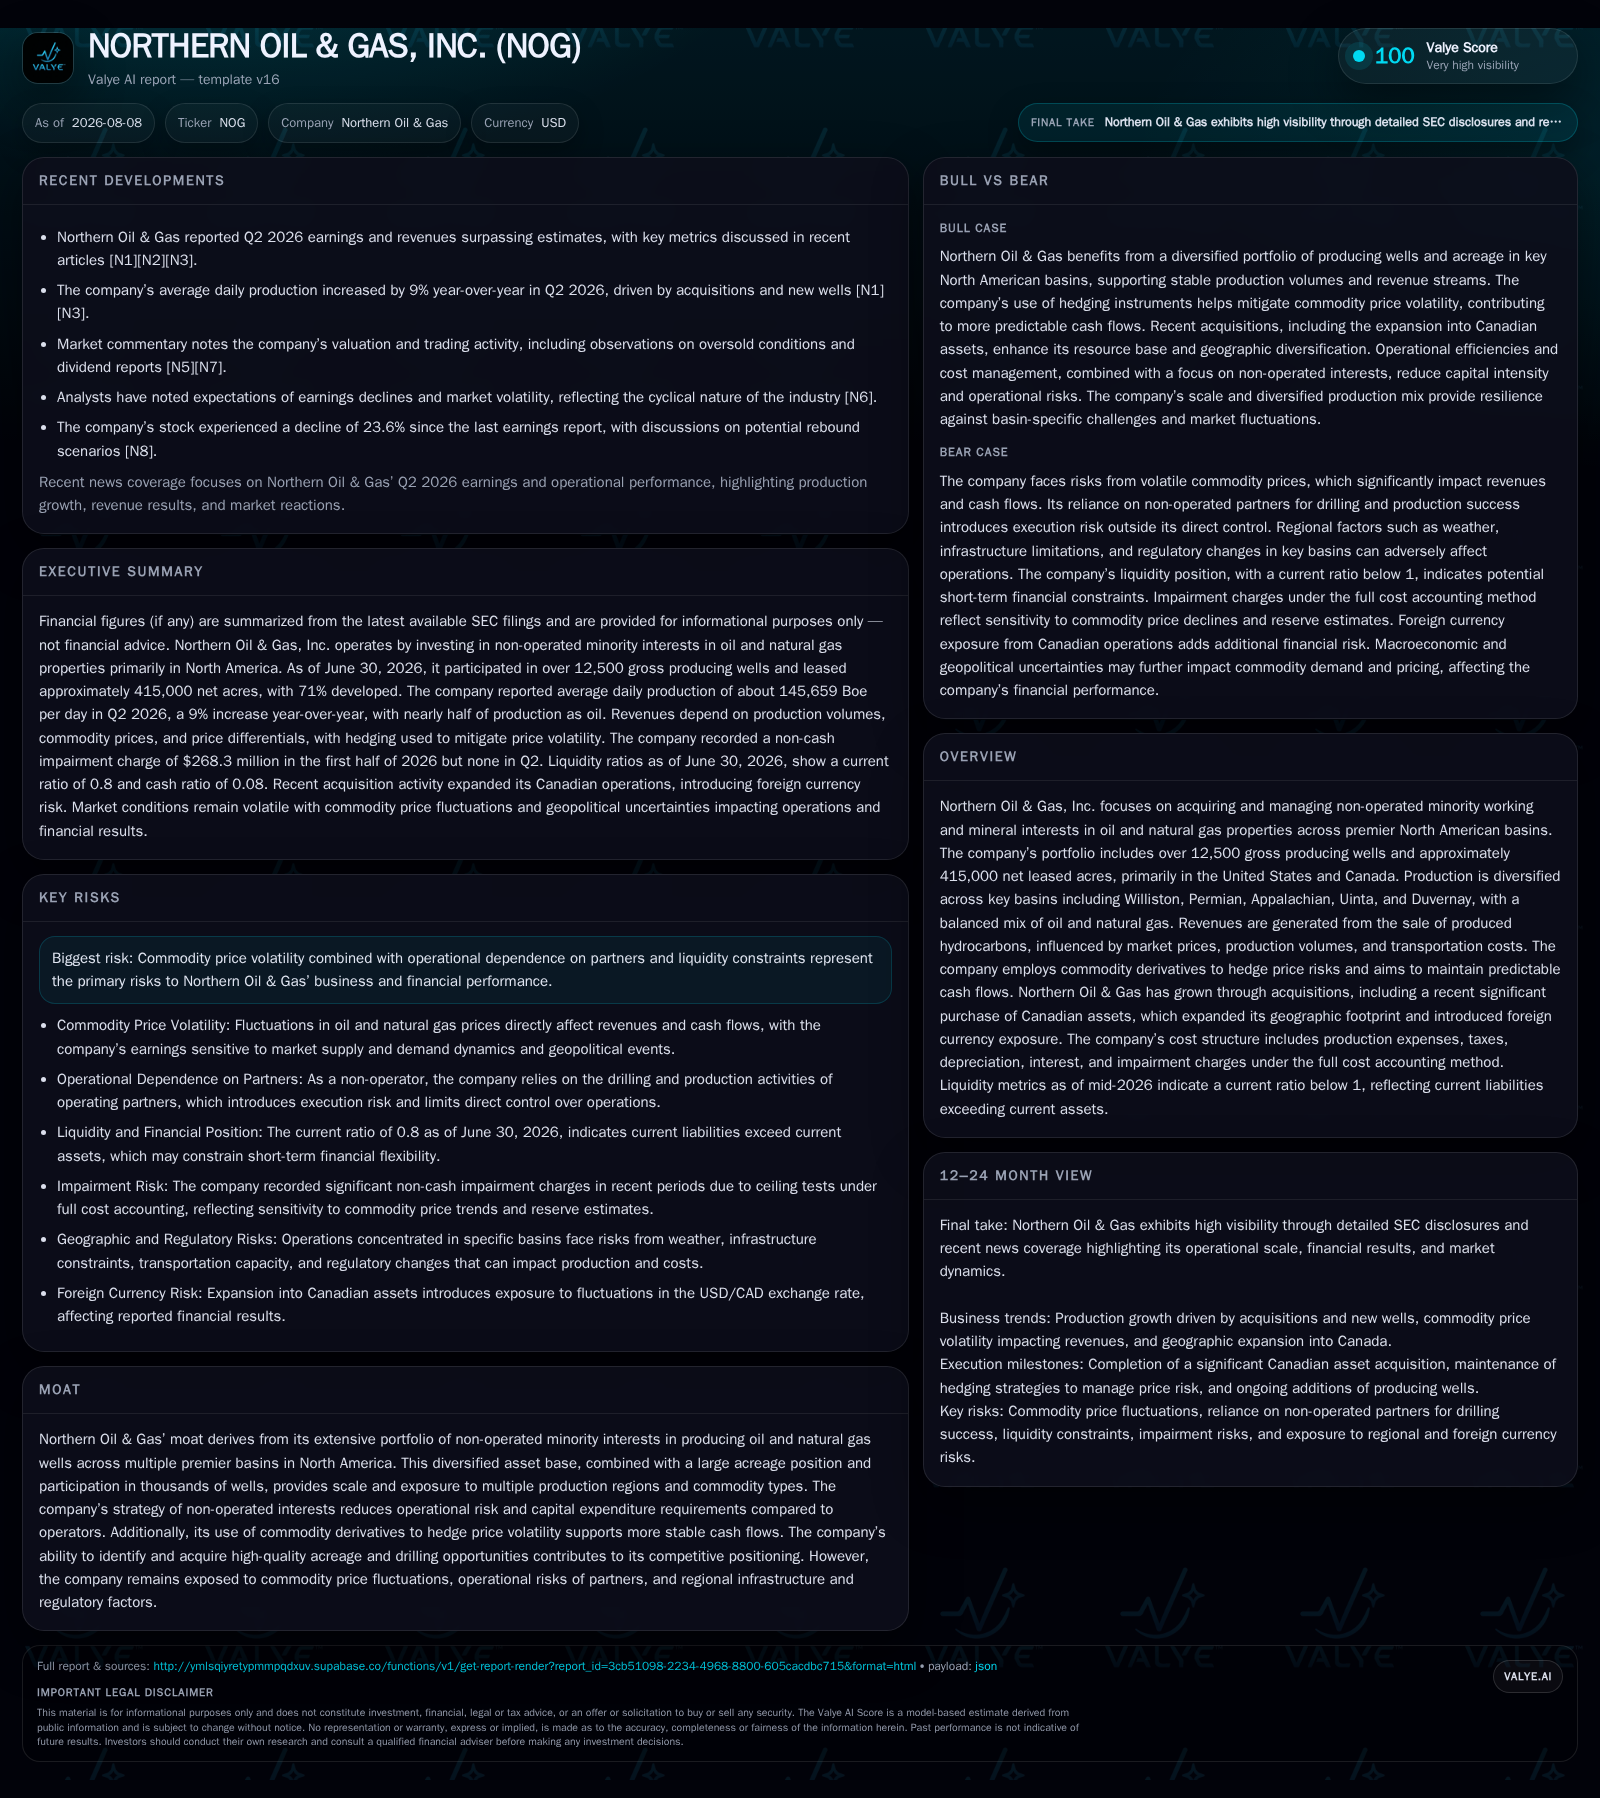
Northern Oil & Gas, Inc. reported a 9% year-over-year increase in average daily production to approximately 145,659 barrels of oil equivalent (Boe) per day in Q2 2026, driven primarily by recent acquisitions—including a major Canadian asset purchase from Parallax Energy—and new wells brought online by operating partners [S2],[S22]. The company’s strategy centers on acquiring non-operated minority working and mineral interests, reducing direct capital expenditures while maintaining exposure to commodity prices and operator execution risks. Its diversified portfolio spans over 12,500 gross producing wells and roughly 415,000 net leased acres with approximately 71% developed across premier basins such as Williston, Permian, Appalachian, Uinta, and Duvernay [S2],[S25]. Despite active commodity derivatives hedging to stabilize cash flows, the company faces ongoing risks from price volatility and price differentials affecting realized revenues [S16]. A $268 million impairment recorded in Q1 was absent in Q2, signaling some stabilization in reserve valuations [S18],[S26]. Financially, Northern carries significant leverage with total debt near $2.75 billion at mid-year against limited cash reserves and a current ratio below one, underscoring the criticality of liquidity management amid capital-intensive operations [F1].
Recent Operating Update: Production Growth Anchored by Acquisitions and Partner Activity
Business Model: Non-Operated Minority Interests Minimize Capex While Exposing to Commodity Price Risk
Northern Oil & Gas specializes in acquiring non-operated minority working interests and mineral rights across premier hydrocarbon basins in North America rather than engaging directly in drilling or operations [S2]. This approach limits direct capital expenditures typical for upstream operators but leaves the company exposed to commodity price fluctuations as well as operational execution risks borne by its partners. As of June 30, 2026, it held interests in approximately 12,507 gross producing wells (about 1,370 net) spanning nearly 415,000 net leased acres—approximately 71% of which are developed—located throughout the United States and Canada [S2]. The company generates revenue from sales of oil, natural gas, and natural gas liquids produced from these properties. To mitigate earnings volatility caused by fluctuating commodity prices, Northern actively employs commodity derivatives covering a significant portion of expected future production volumes; this strategy reduces risk case but also limits upside participation when prices rally [S16],[S25].
Industry Structure and Competitive Position: Diversification Across Basins Balances Risks
The company’s production is geographically diversified across several key basins: Williston (27%), Permian (34%), Appalachian (30%), Uinta (8%), and Duvernay (1%) as measured by Boe production contribution in Q2 2026 [S25]. This spread balances exposure between oil- and gas-focused plays with varying price dynamics tied to benchmarks such as WTI crude oil and Henry Hub natural gas. Such diversification helps mitigate risks related to regional infrastructure constraints like pipeline takeaway capacity or local market pricing differentials that can depress realized prices relative to NYMEX benchmarks [S23],[S16]. The production mix for the quarter was approximately 47% oil—a slight decrease from about 50% earlier in the year—reflecting some variability driven by basin mix or operator activity changes [S13],[S25].
Within the peer landscape for non-operated interest holders—companies like Antero Resources serve as comparators—Northern’s broad multi-basin footprint offers competitive advantages by reducing concentration risk inherent in single-basin strategies while enabling access to diverse acquisition opportunities.
Growth Drivers: Acquisitions and Operator-Led Reserve Replacement
Acquisition activity remains central to Northern’s growth strategy as exemplified by the mid-2026 purchase of Canadian assets from Parallax Energy that expanded its acreage base beyond roughly 400 thousand net developed acres previously concentrated mainly in U.S. basins [S22],[S18]. This expansion not only increases current production volumes but also provides additional drilling optionality alongside established operators.
Reserve replacement relies heavily on successful drilling programs executed by operating partners; Northern benefits when these operators add new wells that contribute incremental production volumes without requiring Northern’s direct capital outlay [S2]. The addition of nearly thirty net wells over six months evidences ongoing development activity supporting sequential volume gains
Commodity price environments remain an overarching influence—higher prices incentivize increased operator drilling activity which indirectly supports Northern’s volume growth potential while improving cash flow generation.
Risks and Watchpoints: Commodity Volatility and Operational Execution
Northern faces typical upstream sector risks heightened by its dependence on third-party operators. Unexpected slowdowns or operational underperformance could impair volume growth or cause declines if offsetting reserve depletion occurs.
Price volatility is a persistent challenge; although derivative hedges provide downside protection they also cap earnings during price rallies potentially limiting margin expansion. Additionally, transportation bottlenecks expressed through widening price differentials between sales prices received versus benchmark NYMEX prices can further compress realized revenues complicating cash flow predictability [S16],[S23].
The company recorded a significant non-cash impairment charge totaling $268 million during Q1 2026 arising from lower commodity price assumptions used in quarterly ceiling tests under full cost accounting principles; however, no impairment was recorded for Q2 suggesting some stabilization or improvement in reserve valuations recently [S18],[S26]. Future impairments remain possible if commodity prices deteriorate substantially or proved reserves are revised downward materially.
Financial leverage is notable with total debt around $2.75 billion at June-end against cash balances just under $50 million coupled with a current ratio near 0.8 indicating current liabilities exceed current assets—a liquidity profile common among capital-intensive upstream companies but requiring careful management of working capital and financing sources [F1]
What to Watch Next
Investors should monitor ongoing operator drilling activity driving net well additions as a barometer of organic growth sustainability. Quarterly updates on average daily production will signal whether growth momentum continues.
Commodity price trends relative to hedging coverage will influence revenue stability; disclosures on derivative positions may provide insight into risk management effectiveness.
Post-acquisition integration outcomes for Canadian assets including operational efficiencies or reserve revisions will be important indicators of successful scale expansion.
Any shifts in financial leverage or liquidity management through refinancing or capital raises would warrant close attention given existing indebtedness.
Financial Profile Discussion
As of June 30, 2026, Northern Oil & Gas held cash and equivalents totaling approximately $47.6 million alongside total debt obligations near $2.75 billion resulting in an estimated net debt position around $2.7 billion with a current ratio approximating 0.8 due to current liabilities exceeding current assets [$502 million vs. $630 million] consistent with upstream industry norms balancing working capital needs against financing structures [F1]
Operating expenses encompass costs related to maintaining producing properties including field personnel compensation, natural gas processing fees, salt water disposal costs, utilities maintenance plus transportation-related differentials that impact realized prices relative to NYMEX benchmarks [S16],[S23]. Interest expense reflects financing costs including amortization of bond premiums/discounts along with settled interest rate derivatives affecting borrowing costs within a highly leveraged capital structure typical for exploration companies relying primarily on debt markets for growth funding over short cycles rather than free cash flow generation alone [S4],[F1].
Impairment charges mandated quarterly under full cost accounting reached $268 million in Q1 but subsided entirely in Q2 reflecting fluctuating commodity price assumptions—continued sensitivity here requires monitoring as these non-cash charges influence book equity though not immediate cash flow impact [S18],[S26].
Overall financial metrics underscore a business model focused on efficient capital deployment amid cyclical commodity markets leveraging acquisitions and hedging strategies aimed at stabilizing cash flow despite elevated leverage.
Disclaimer: This analysis is based exclusively on publicly available information from filings dated August 7 and August 6, 2026 ([S2],[S3]), supplemented by companyfacts snapshot data as of June 30, 2026 ([F1]) alongside contextual industry knowledge. It does not constitute investment advice.
Disclaimer: This is research-only, informational analysis and not investment advice. It may include AI-generated interpretation and general industry context. Always verify important details using primary sources.

Comments