
ServiceNow’s Q2 2026 Performance Validates AI-Driven Workflow Expansion Amid Liquidity Pressure
ServiceNow’s latest quarter underscores strong demand for AI-powered workflow automation as it balances growth opportunities with financial leverage constraints.
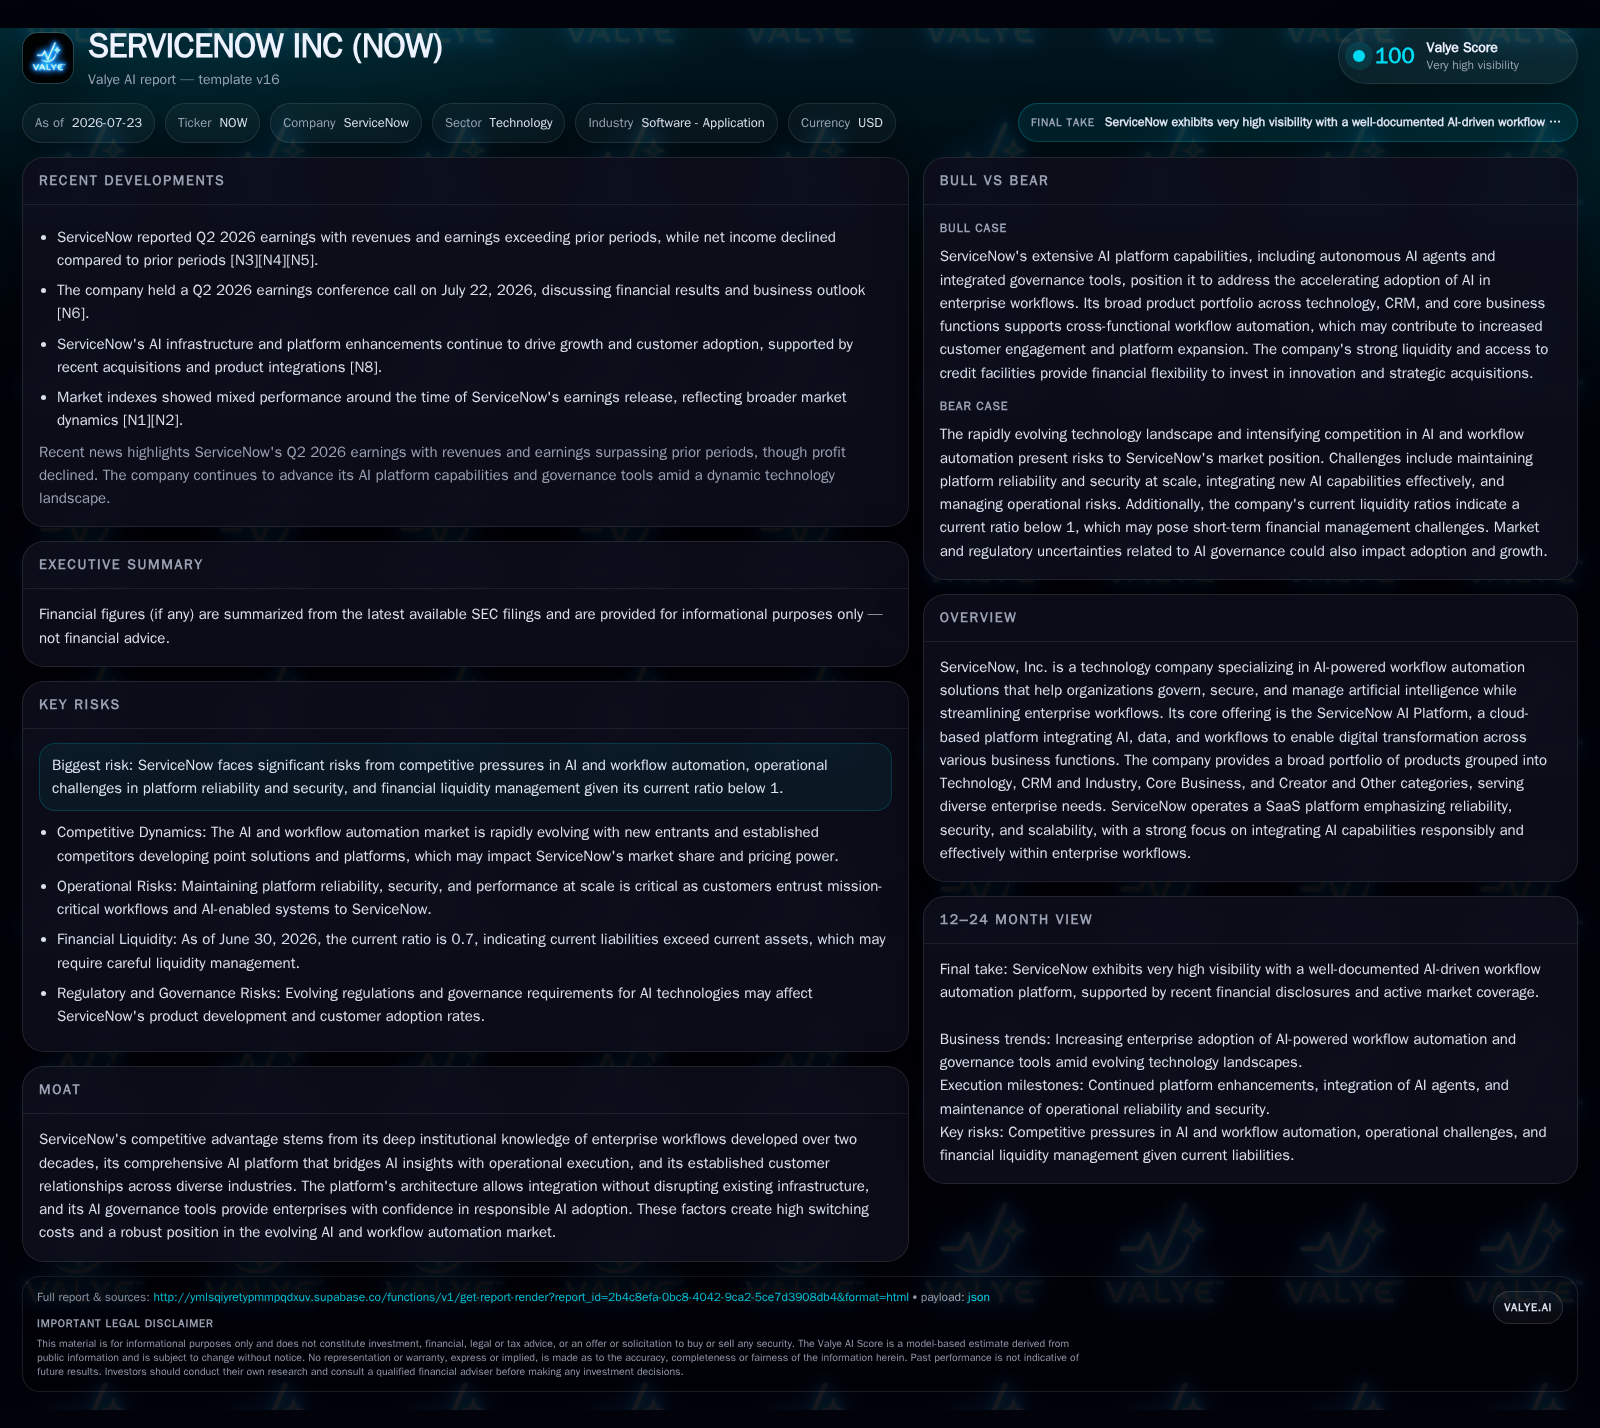
ServiceNow reported Q2 2026 results demonstrating solid annual recurring revenue growth driven by adoption of its AI-enabled workflow automation platform, confirming its entrenched competitive position in enterprise SaaS. The ServiceNow AI Platform's integration depth and governance capabilities remain critical differentiators, fueling high customer retention and seat expansions despite intensifying competitive pressures from peers like Salesforce and UiPath. However, the company faces liquidity challenges, evidenced by a sub-1.0 current ratio and substantial net debt, which may constrain discretionary spending and innovation investment in the near term. Close monitoring of ARR trajectory, client retention metrics, and debt management will be key to sustaining momentum.
AI-Enabled Workflow Expansion Drives Second Quarter Growth Momentum
Key drivers behind this momentum include sustained seat or user count expansions within existing clients, which reflect usage-based intensity growing alongside broader organizational digital transformation efforts. Furthermore, the layering of AI capabilities onto traditional IT service management workflows appears to enhance the stickiness of ServiceNow's offerings, contributing to resilient customer engagement despite macroeconomic uncertainties.
Platform Differentiation Anchored on Integration Depth and Governance Capabilities
The architectural backbone of ServiceNow’s offering is its proprietary AI Platform — a cloud-native environment designed to unify AI insights with operational execution while embedding governance controls essential for managing risks associated with artificial intelligence [S1]. This addresses a critical challenge wherein standalone AI models cannot independently execute business transactions or enforce compliance mandates.
By providing integration APIs and workflow automation tools that seamlessly connect various systems of record without infrastructure disruption, ServiceNow creates substantial switching costs for clients. Additionally, its emphasis on security and responsible AI governance aligns well with increasing regulatory scrutiny on enterprise data privacy and algorithmic accountability. This combination positions ServiceNow’s platform as a compelling alternative to isolated robotic process automation (RPA) offerings seen in competitive vendors.
Competitive Moat Reinforced but Scaling Pressures Intensify Market Dynamics
ServiceNow’s moat derives from over two decades of developing institutional knowledge around enterprise workflows coupled with strong customer relationships spanning diverse industries. Against peers like Salesforce CRM — a recognized leader in enterprise SaaS growth and retention — and specialized workflow vendors such as UiPath focused on RPA, ServiceNow maintains an advantage through breadth of product portfolio and deeper embeddedness in core operational processes.
However, the technology sector’s rapid evolution necessitates continuous innovation investments to fend off competition not only from other SaaS platforms but also from emerging AI-centric startups ramping up feature-rich applications. These dynamics create margin trade-offs since R&D intensity must be balanced with profitability targets. Industry context suggests firms able to scale platform capabilities reliably while expanding cloud gross margin tend to sustain competitive advantage over long cycles.
Key Growth Levers: Customer Expansion, Ecosystem Integration, and Geographic Reach
ServiceNow’s revenue expansion strategy hinges substantially on net dollar retention driven by seat/user increases within existing clients reflecting broader workflow digitization initiatives [S1]. Cross-selling into new departments or extending into complementary vertical applications broadens wallet share per customer
Geographically, penetrating emerging markets presents a tangible runway for future growth given ongoing shifts from legacy on-premises to cloud software consumption models globally. Moreover, regulatory drivers such as compliance mandates around data governance underpin steady demand for ServiceNow’s risk management and policy enforcement modules within its platform suite.
Ecosystem integration with major cloud providers and adjacent software environments enhances product appeal by simplifying implementation complexity for IT buyers — this interoperability via robust APIs supports customer satisfaction metrics vital for retention.
Watchpoints: Liquidity Constraints and Evolving Enterprise IT Spending Patterns
A notable caution arises from ServiceNow’s financial positioning where the current ratio stands at approximately 0.7 as of June 30, indicating working capital tightness influenced by current liabilities exceeding current assets substantially [F1]. Total debt hovers near $5.44 billion against cash & equivalents at roughly $2.5 billion generating net debt around $2.9 billion — levels that heighten liquidity risk especially given maturities clustered within the next year including a $4 billion unsecured term loan due October 2026 [F1].
These leverage metrics suggest potential constraints on discretionary spending flexibility that could impact timely innovation investments crucial for maintaining pace amid evolving SaaS market challenges. Additionally, macroeconomic factors influencing enterprise IT budgets could moderate new customer acquisition velocity or slow down user expansions within accounts.
Next Steps: Monitoring ARR Trajectory, Client Retention, and Debt Management Strategy
Upcoming quarterly disclosures will be critical to observe trends in annual recurring revenue growth rate stability and customer net retention rates which are bellwethers for predicting durable recurring revenue streams essential to SaaS valuations [S2][S3]
Management commentary around refinancing strategies or capital structure optimization will provide insight into how effectively ServiceNow plans to navigate looming debt maturities while supporting its R&D roadmap amidst ongoing competitive pressures.
Efficiency enhancements in sales cycles or elevated usage metrics such as API transactions reflecting deeper platform engagement could signal strengthening fundamentals beyond headline revenue numbers.
Financial Profile Discussion: Navigating Leverage Amid Innovation Investment
From a financial standpoint, ServiceNow’s balance sheet presents mixed signals. Cash reserves near $2.5 billion provide a reasonable liquidity buffer; however, the $5.44 billion total indebtedness contributes to a net leverage position of roughly $2.9 billion as of June 30 [F1]. The sub-1.0 current ratio (~0.7) flags short-term liquidity pressure largely due to elevated current liabilities implicating working capital management challenges [F1].
The company’s issuance of multiple notes and a substantial unsecured term loan earlier this year increased interest obligations but was partly deployed to fund strategic acquisitions such as Armis Security Ltd., indicating an aggressive growth posture via inorganic channels [S4][S24]. Maintaining free cash flow conversion amid high R&D spend will be pivotal to balancing innovation funding against financial prudence.
This analysis is based solely on publicly available SEC filings dated through July 23, 2026, supplemented by industry contextual understanding as detailed in the sector guidance provided above. It reflects no forward-looking statements nor investment research views but aims to elucidate structural business factors shaping ServiceNow's operating environment at this juncture.
Disclaimer: This is research-only, informational analysis and not investment advice. It may include AI-generated interpretation and general industry context. Always verify important details using primary sources.

Comments