
O'Reilly Automotive's Earnings Pulse: Expansion Challenges and Financial Returns
Evaluating how O'Reilly Automotive’s dual market strategy and capital deployment shaped its 2025 financial results amidst evolving market dynamics.
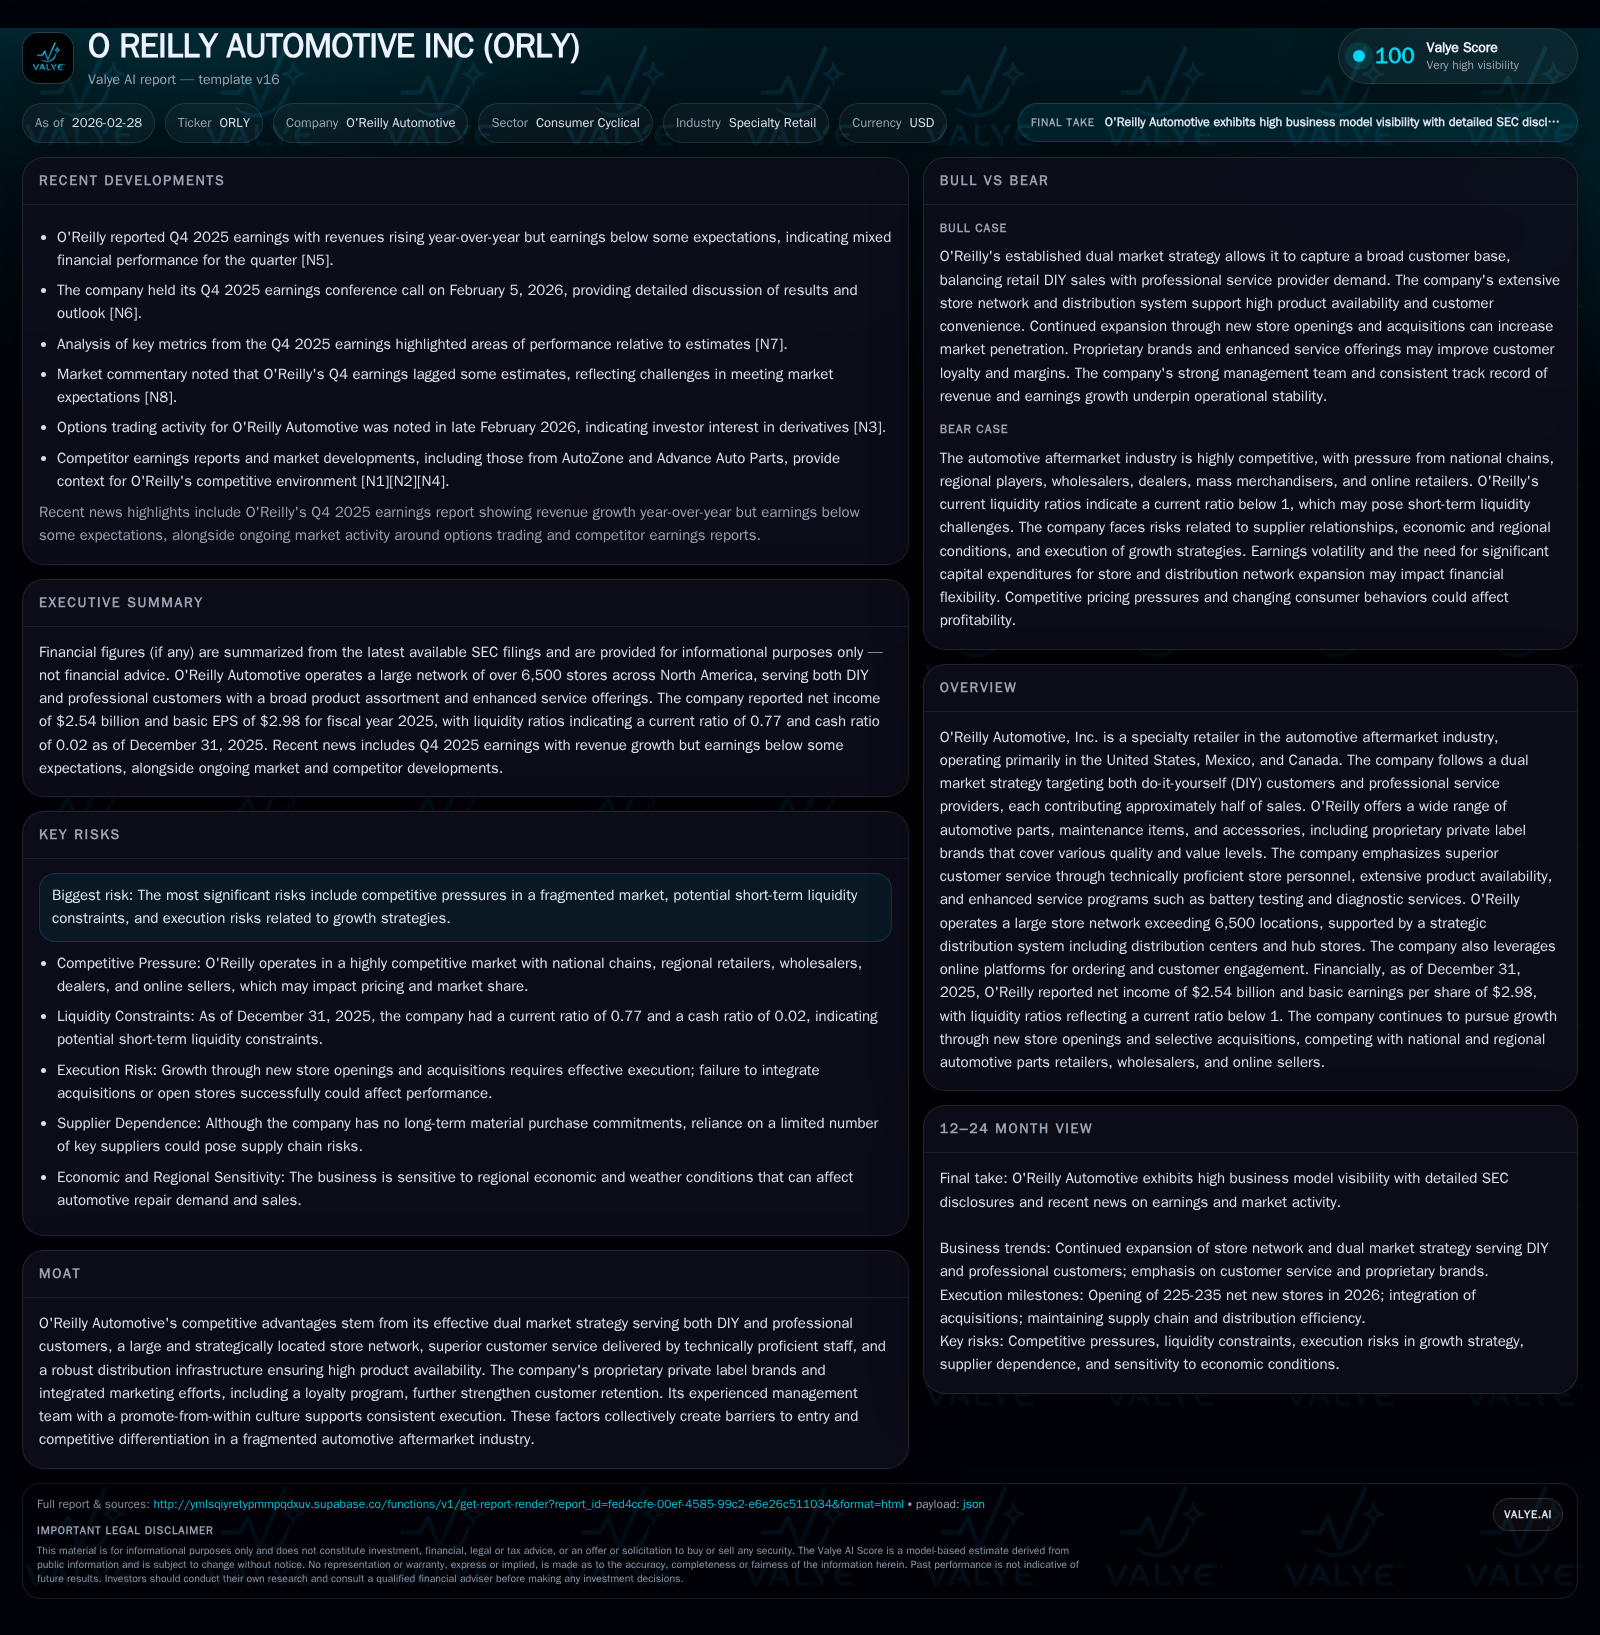
O'Reilly Automotive sustained steady revenue growth over recent years driven by its balanced focus on DIY and professional customers alongside strategic store expansion. Fiscal 2025 operating income and net income rose modestly, supported by operational efficiencies despite a notable Q4 earnings miss attributed to transient cost pressures and competitive challenges. The company’s large distribution network and proprietary private label brands underpin its market positioning, though liquidity metrics and aggressive share repurchases highlight financial tradeoffs. Looking forward, management’s plan to open over 225 new stores signals confidence in expansion but warrants close monitoring of execution risks and capital allocation efficiency.
A Robust Wholesale and Retail Footprint Fuels Historical Revenue Expansion
O'Reilly Automotive has demonstrated sustained revenue growth fueled by an expansive store footprint across the United States, Mexico, and Canada that caters evenly to do-it-yourself (DIY) customers and professional service providers. Revenues increased from approximately $1.76 billion in fiscal year (FY) 2014 to about $3.46 billion by the end of FY2025 [F1], reflecting strategic store network growth—culminating at over 6,500 locations—and increasing penetration into adjacent markets through new store openings and selective acquisitions [S25][S22].
The company's dual market strategy enables capturing demand across a fragmented automotive aftermarket serving both DIY consumers performing their own repairs and professional shops requiring high-volume parts supply [S6]. Roughly half of sales derive from each segment as of the latest reports [S6], with professional provider sales growing faster due to consolidation opportunities within local shop ecosystems.
Private label brand introductions covering diverse quality tiers appeal broadly—from value-conscious DIYers choosing "good" brands to professionals selecting "best" tier proprietary products for assured quality [S12].
Historical performance (annual)
| FY | Net ($bn) | CFO ($bn) | OpInc ($bn) | Capex ($mm) | Net YoY |
|---|---|---|---|---|---|
| 2025 | 2.5 | 2.8 | 3.5 | 1169 | +6.3% |
| 2024 | 2.4 | 3.0 | 3.3 | 1023 | +332.0% |
| 2023 | 0.6 | 3.0 | 0.7 | 1006 | +4.5% |
| 2022 | 0.5 | 3.1 | 0.7 | 563 |
Source: SEC companyfacts cache [F1].
Capital returns and efficiency (annual)
| FY | Buybacks ($bn) | FCF ($bn) | ROE% |
|---|---|---|---|
| 2025 | 2.1 | 1.6 | -332.5 |
| 2024 | 2.1 | 2.0 | -174.1 |
| 2023 | 3.2 | 2.0 | -31.8 |
| 2022 | 3.3 | 2.6 | -49.8 |
Source: SEC companyfacts cache [F1].
Revenue figures approximated from reported data; detailed annual values available at [F1].
Unpacking Operating Income and Profitability Trends for FY2025
Operating income advanced approximately 6.4% year-over-year to about $3.46 billion in FY2025 [F1], outpacing top-line growth slightly which indicates operational leverage despite inflationary pressures noted in regulatory filings [S3]. Net income rose roughly 6.3% to around $2.54 billion [F1], indicating effective expense control alongside investment in growth initiatives.
Margins benefit from higher professional segment sales which generally command lower gross margins than DIY retail but provide volume stability and recurring orders [S6]. Operational improvements within distribution centers and refined inventory management likely contributed positively amid broader input cost inflation.
Q4 Earnings Miss: Elevated Costs Amid Competitive Pressures
Despite full-year gains, Q4 results released early February showed an earnings miss relative to consensus estimates due primarily to elevated operating expenses such as labor and transportation costs linked to supply chain investments [N3][N6][S3]. Competitive pricing actions were necessary to maintain market share versus peers like AutoZone and Advance Auto Parts [N3][N5].
Management framed these headwinds as largely transitory, related to investments supporting long-term growth including technology integration for professional customers and heightened advertising spend in key markets [N4][N8]. Guidance reflected caution on margin recovery near term.
Dual Market Synergy: Balancing DIY and Professional Segments
O'Reilly's advantage lies in servicing both DIY end-users seeking convenience, expert advice, and value products alongside professional service providers demanding broad assortments, rapid delivery, specialized programs like Certified Auto Repair support, and business tools [S6][S17].
This bifurcated approach adds complexity—professional sales often involve contractual terms, volume discounts, specialized SKUs at hubs versus promotional-driven retail DIY sales—but diversifies revenue streams across economic cycles.
Margin profiles differ: retail DIY typically yields higher per-unit margins but is price sensitive; professionals offer steadier volumes at scale with lower per-unit margins . Inventory strategies balance these factors leveraging a tiered warehouse model.
Proprietary Brands and Omnichannel Marketing Drive Customer Engagement
O'Reilly’s proprietary private labels span "good," "better," and "best" categories providing multi-tier appeal critical in specialty automotive aftermarket where brand trust influences purchasing heavily [S12]. These brands enable stronger margin capture compared to national brands.
Customer engagement is augmented through an integrated omnichannel marketing strategy combining digital personalization (e-mail/text), a loyalty program rewarding repeat purchases (O'Rewards), broadcast media targeting Spanish-speaking populations, event sponsorships, regional outreach, plus social media activations [S4].
On the professional side, dedicated e-commerce portals like www.OReillyPro.com offer convenience with features such as multiple daily deliveries supported by territory sales managers fostering client relationships.
Distribution Network Efficiency: Backbone of Product Availability
A core competitive strength is O’Reilly’s extensive tiered distribution network with approximately 32 distribution centers totaling over 14 million square feet plus nearly 400 hub stores strategically placed for maximal coverage [S11][S26]. DCs stock over 156,000 SKUs on average; hubs carry up to roughly 115,000 SKUs enabling same or next-day fill rates crucial for just-in-time parts availability especially demanded by professionals.
Multiple daily deliveries including seven-day service windows reduce stockouts that impair customer satisfaction; this logistical sophistication supports high store-level inventory turnover while managing working capital costs despite a slight CFO decline noted [F1][S11].
Planned automation investments (conveyors/picking modules) plus routing software reflect ongoing productivity improvement efforts targeting margin expansion.
Capital Allocation: Share Repurchases Balanced Against Growth Investments
In fiscal year 2025, O'Reilly repurchased shares totaling about $2.1 billion—consistent with prior years—demonstrating a commitment to shareholder returns even as capital expenditures rose by approximately 14% to nearly $1.17 billion focusing on new store openings and distribution enhancements [F1][S24].
Operating cash flow declined by nearly 9.4% year-over-year to about $2.76 billion likely impacted by working capital shifts including inventory build related to supply chain or seasonal factors [F1]. Nevertheless, free cash flow (operating cash flow less capex) remained positive near $1.59 billion.
The company’s negative equity position of approximately -$763 million reflects accumulated treasury stock from buybacks rather than operational distress—a phenomenon seen when retailers aggressively repurchase shares [F1] analysis.
Risks: Liquidity Constraints and Competitive Environment
A current ratio near a constrained ~0.77 indicates tight short-term liquidity typical for retail but requiring careful working capital management especially during volatility or unexpected shocks [F1][S10].
Competitive pressures remain intense from national chains plus regional jobbers and online retailers competing on price and availability as detailed in risk disclosures including supplier concentration (~23% purchases from top five suppliers), economic conditions sensitivity, weather impacts on demand patterns, labor availability constraints, among others [S7]["Risk Factors" section].
Execution risk arises from ambitious plans to open over 225 net new stores in calendar year 2026 demanding seamless integration without diluting returns or stressing logistics capabilities.
Outlook: Key Milestones Ahead for Investors
Upcoming quarterly earnings releases will provide insight into margin stabilization post-Q4 headwinds alongside progress updates on the new store pipeline relative to targets exceeding three hundred net new stores over subsequent periods per recent guidance [N11][N12].
Capital expenditure efficiency will be closely watched given its sharp increase aligned with distribution improvements aiming at longer-term profitability gains; any overruns or supply disruptions warrant scrutiny.
Balancing ongoing investment needs amid liquidity constraints while steering dual market channels remains central to O'Reilly’s forward trajectory.
Disclaimer: This analysis is based solely on publicly available information sourced as cited above for informational purposes only without investment advice or recommendations.
Disclaimer: This is research-only, informational analysis and not investment advice. It may include AI-generated interpretation and general industry context. Always verify important details using primary sources.

Comments