
O'Reilly Automotive Expands Market Reach with Strong Q1 Sales Amid Supply Chain and Debt Management
Robust quarterly sales growth reflects O’Reilly Automotive’s dual market strategy execution and operational efficiency.
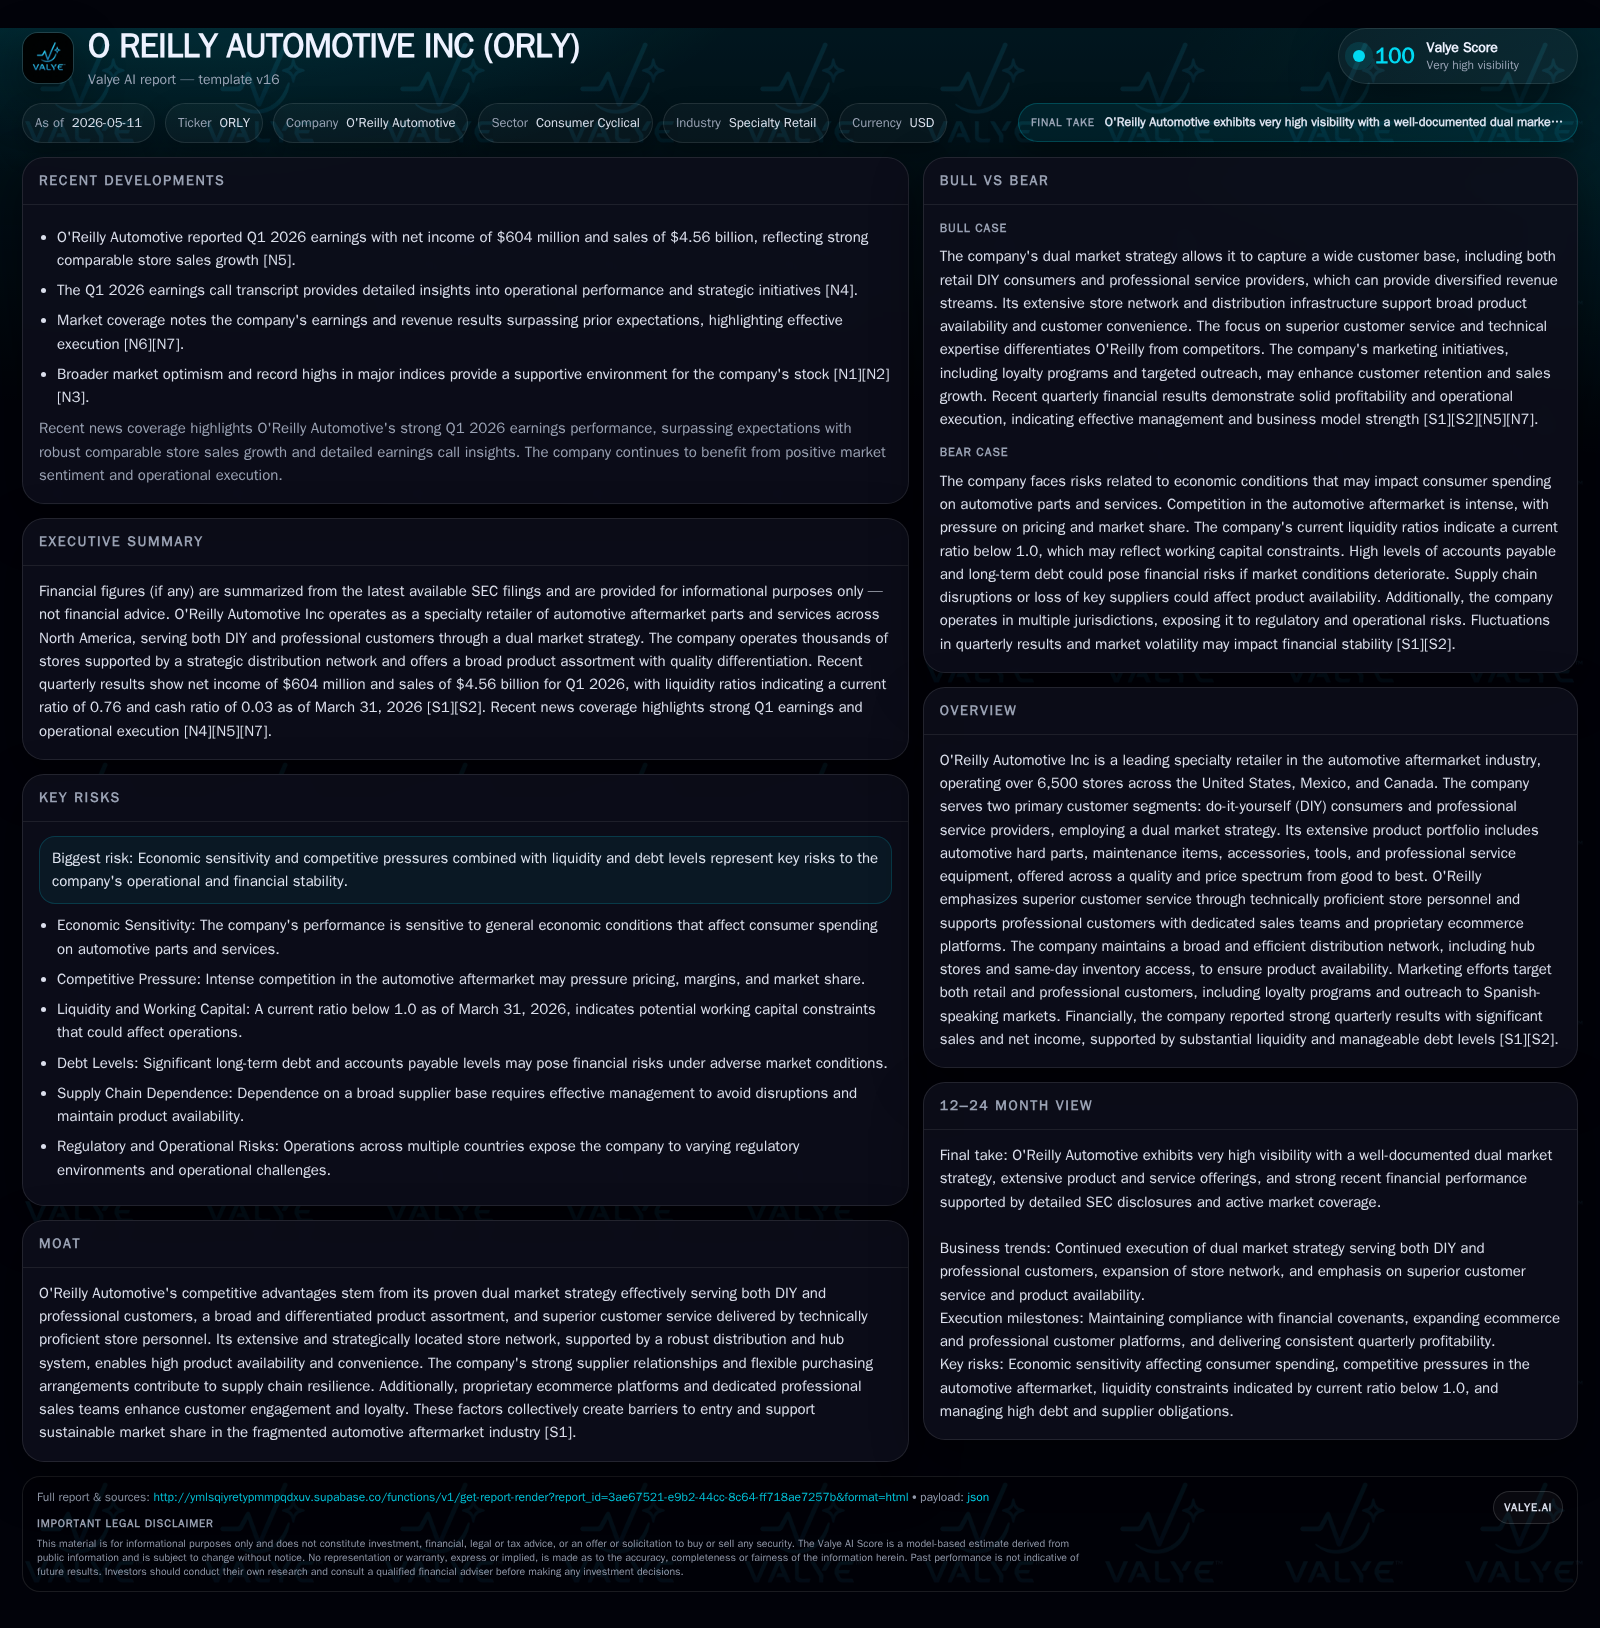
In its Q1 2026 filing, O'Reilly Automotive reported $4.56 billion in sales, up from $4.14 billion year-over-year, underscoring sustained demand growth in the automotive aftermarket. The company’s dual focus on DIY consumers and professional service providers drives broad-based revenue expansion while maintaining strong gross margins through efficient supply chain management. Despite sizable outstanding debt exceeding $6.2 billion, O'Reilly remains compliant with credit covenants and leverages a commercial paper program to support liquidity and working capital needs. Future growth will depend on continued store network expansion, ecommerce adoption by professionals, and management of economic cyclicality and competitive pressures.
Recent Operating Update
O'Reilly Automotive's first quarter ending March 31, 2026, showcased meaningful top-line momentum with sales reaching approximately $4.56 billion, marking a noteworthy increase from $4.14 billion during the same period in 2025 [S2]. This growth is largely attributed to heightened demand across both the do-it-yourself (DIY) consumer segment and professional service provider base—the company's hallmark dual market strategy. Gross profit expanded commensurately to around $2.35 billion despite rising costs associated with warehouse operations and distribution efficiency enhancements.
The company also experienced a rise in team member compensation expenses to roughly $928 million for the quarter, reflecting investments in skilled staff essential to maintain superior customer service standards across its retail footprint and professional sales teams [S2]. Rent and operating lease expenses were stable but monitored closely given their impact on fixed cost structure.
On liquidity frontiers, O'Reilly maintains financial flexibility through its recently established commercial paper program that permits issuance of up to $2.25 billion in unsecured notes with maturities under one year—an important complement to its existing revolving credit facility which remains undrawn as of quarter-end [S2], [F1]. Total long-term debt hovers near $6.22 billion at quarter end with net debt adjusted for cash balances at about $5.97 billion [F1]. The company confirms full compliance with lending covenants under current credit agreements providing operational stability during ongoing capital deployment initiatives.
Business Model
O’Reilly Automotive earns revenue primarily by retailing automotive aftermarket parts including hard parts, maintenance supplies, tools, accessories, and professional equipment targeting two distinct customer groups: retail DIY customers and professional installers/mechanics [S1]. The latter constitutes a significant share bolstered through dedicated sales teams and a proprietary ecommerce platform (www.OReillyPro.com) tailored for fast ordering and replenishment.
The revenue model hinges on high product availability enabled by an extensive network of over 6,500 physical stores strategically located throughout North America coupled with an efficient tiered distribution system featuring regional hubs enabling same-day delivery at many locations—critical factors in the highly fragmented aftermarket landscape where reliability is paramount.
Pricing strategy spans from value offerings targeting cost-conscious DIY customers to premium product lines appealing largely to professionals requiring quality parts for repairs under warranty or certification programs such as Certified Auto Repair [S1]. Loyal consumer engagement is reinforced by the O’Rewards program incentivizing repeat purchases.
Margins benefit from scale economies in procurement and logistics alongside selective product mix optimization between commodity maintenance items and higher-margin specialized components.
Industry Structure and Competitive Position
The automotive aftermarket industry is inherently fragmented composed of large specialty retailers like O’Reilly Automotive competing alongside national chains (AutoZone, Advance Auto Parts), local parts suppliers, online pure plays (Amazon), and manufacturer authorized dealers. O’Reilly differentiates itself through:
- Effective dual market approach serving both DIY consumers requiring technical guidance and professionals demanding high-volume product availability.
- Extensive geographically dispersed store presence enabling convenient access beyond urban centers where independents operate.
- Robust supply chain architecture minimizing stockouts via hub distribution centers enhancing fill rates critical for service providers.
- Proprietary ecommerce solutions serving professional customers allowing seamless ordering patterns vital for shop operations.
- Investment in technically proficient store personnel called Professional Parts People who enhance service accuracy reducing returns/warranty claims [S1].
Its moat is supported by high switching costs for professional customers relying on dependable delivery schedules and tailored business support services such as training programs addressing evolving vehicle technology trends.
Growth Drivers
O’Reilly’s growth cadence is multifaceted:
- Store Expansion: Continuing targeted new store openings strengthens footprint especially in underpenetrated regions across Mexico and Canada alongside incremental US sites boosts incremental revenue flow.
- Professional Customer Penetration: Increasing wallet share among existing professional accounts driven by dedicated sales coverage combined with digital sales channel adoption elevates volume throughput.
- Product Mix Enhancement: Expansion into higher margin categories such as tools/equipment plus certified repair programs supports better profitability.
- Loyalty Programs: Aggressive marketing leveraging broad demographic appeal including Spanish-speaking markets helps deepen customer retention among DIY clientele.
- Supply Chain Efficiencies: Continual improvements in inventory management reduce working capital requirements while improving product availability — crucial for sustained order fulfillment especially in time-sensitive professional repairs.
These drivers correlate directly to KPIs like comp store sales growth, professional account count increases, average transaction size lift, fill rate percentages across distribution hubs, and reward program active membership trends [S1], [N4].
Risks / Constraints
Despite compelling positives there are notable risks:
- Economic Sensitivity: DIY spending can be volatile tied closely to discretionary income cycles; recessions could dampen volume especially on non-essential automotive accessories.
- Competitive Pricing Pressure: Intense rivalry from other operators including e-commerce disruptors may erode pricing power necessitating higher promotional spend impacting gross margins.
- Supply Chain Disruptions: Any interruptions from supplier concentration or logistical bottlenecks can result in out-of-stocks hurting customer satisfaction particularly among professionals requiring reliability.
- Leverage Profile: The company carries substantial net debt near $6.0 billion as of quarter-end, which may constrain operational agility; however, it remains compliant with current lending covenants [F1].
- Legal & Regulatory Environment: Exposure to litigation associated with product liability or regulations impacting labor/leased property costs can impose unexpected financial burdens [S6].
Guidance updates or commentary around material changes in consumer behavior or supplier relationships will also be important execution markers [N4], [S23].
Financial Profile Summary
Latest financial snapshot
| Metric | Value | Period |
|---|---|---|
| Cash & equivalents | $253mm | |
| 2026-03-31 | ||
| Total debt | $6.2bn | |
| 2026-03-31 | ||
| Net debt | $6.0bn | |
| 2026-03-31 | ||
| Current assets | $7.0bn | |
| 2026-03-31 | ||
| Current liabilities | $9.2bn | |
| 2026-03-31 | ||
| Current ratio | 0.76x | |
| 2026-03-31 |
Source: SEC companyfacts cache [F1].
| Metric | Value (USD) | Period End |
|---|---|---|
| Cash & Equivalents | $252.6 million | |
| 2026-03-31 | ||
| Total Debt | $6.225 billion | |
| 2026-03-31 | ||
| Net Debt | ~$5.97 billion | |
| 2026-03-31 | ||
| Current Assets | $6.967 billion | |
| 2026-03-31 | ||
| Current Liabilities | $9.224 billion | |
| 2026-03-31 | ||
| Current Ratio | 0.76 | |
| 2026-03-31 |
The balance sheet reflects significant inventory levels consistent with large store/dc network requirements along with sizeable short-term liabilities partially reflecting supplier finance programs totaling over $5 billion payable within current liabilities [F1], [S20]. Despite leverage intensity, debt structure includes multiple senior notes maturing between 2026–2036 with manageable effective interest rates below ~5.8% accompanied by an unused revolving credit facility enhancing liquidity optionality [S8],[S9]. Strong cash flow generation supports ongoing share repurchase initiatives evidenced by nearly $400 million spent early May under its extensive buyback authorization demonstrating confidence in underlying free cash flow capability ([S23]).
This analysis synthesizes publicly disclosed SEC filings alongside recent news coverage without offering investment advice or price targets. It focuses on operational fundamentals, strategic positioning, competitive dynamics, risk factors, and near-term financial health framed to aid industry-informed understanding rather than specific investor recommendations.
Disclaimer: This is research-only, informational analysis and not investment advice. It may include AI-generated interpretation and general industry context. Always verify important details using primary sources.
Comments