
Octave Specialty Group Seeks Growth While Managing Capital Constraints and Regulatory Complexity
OSG balances expansion in niche insurance distribution and specialty P&C underwriting amid volatile earnings and leverage.
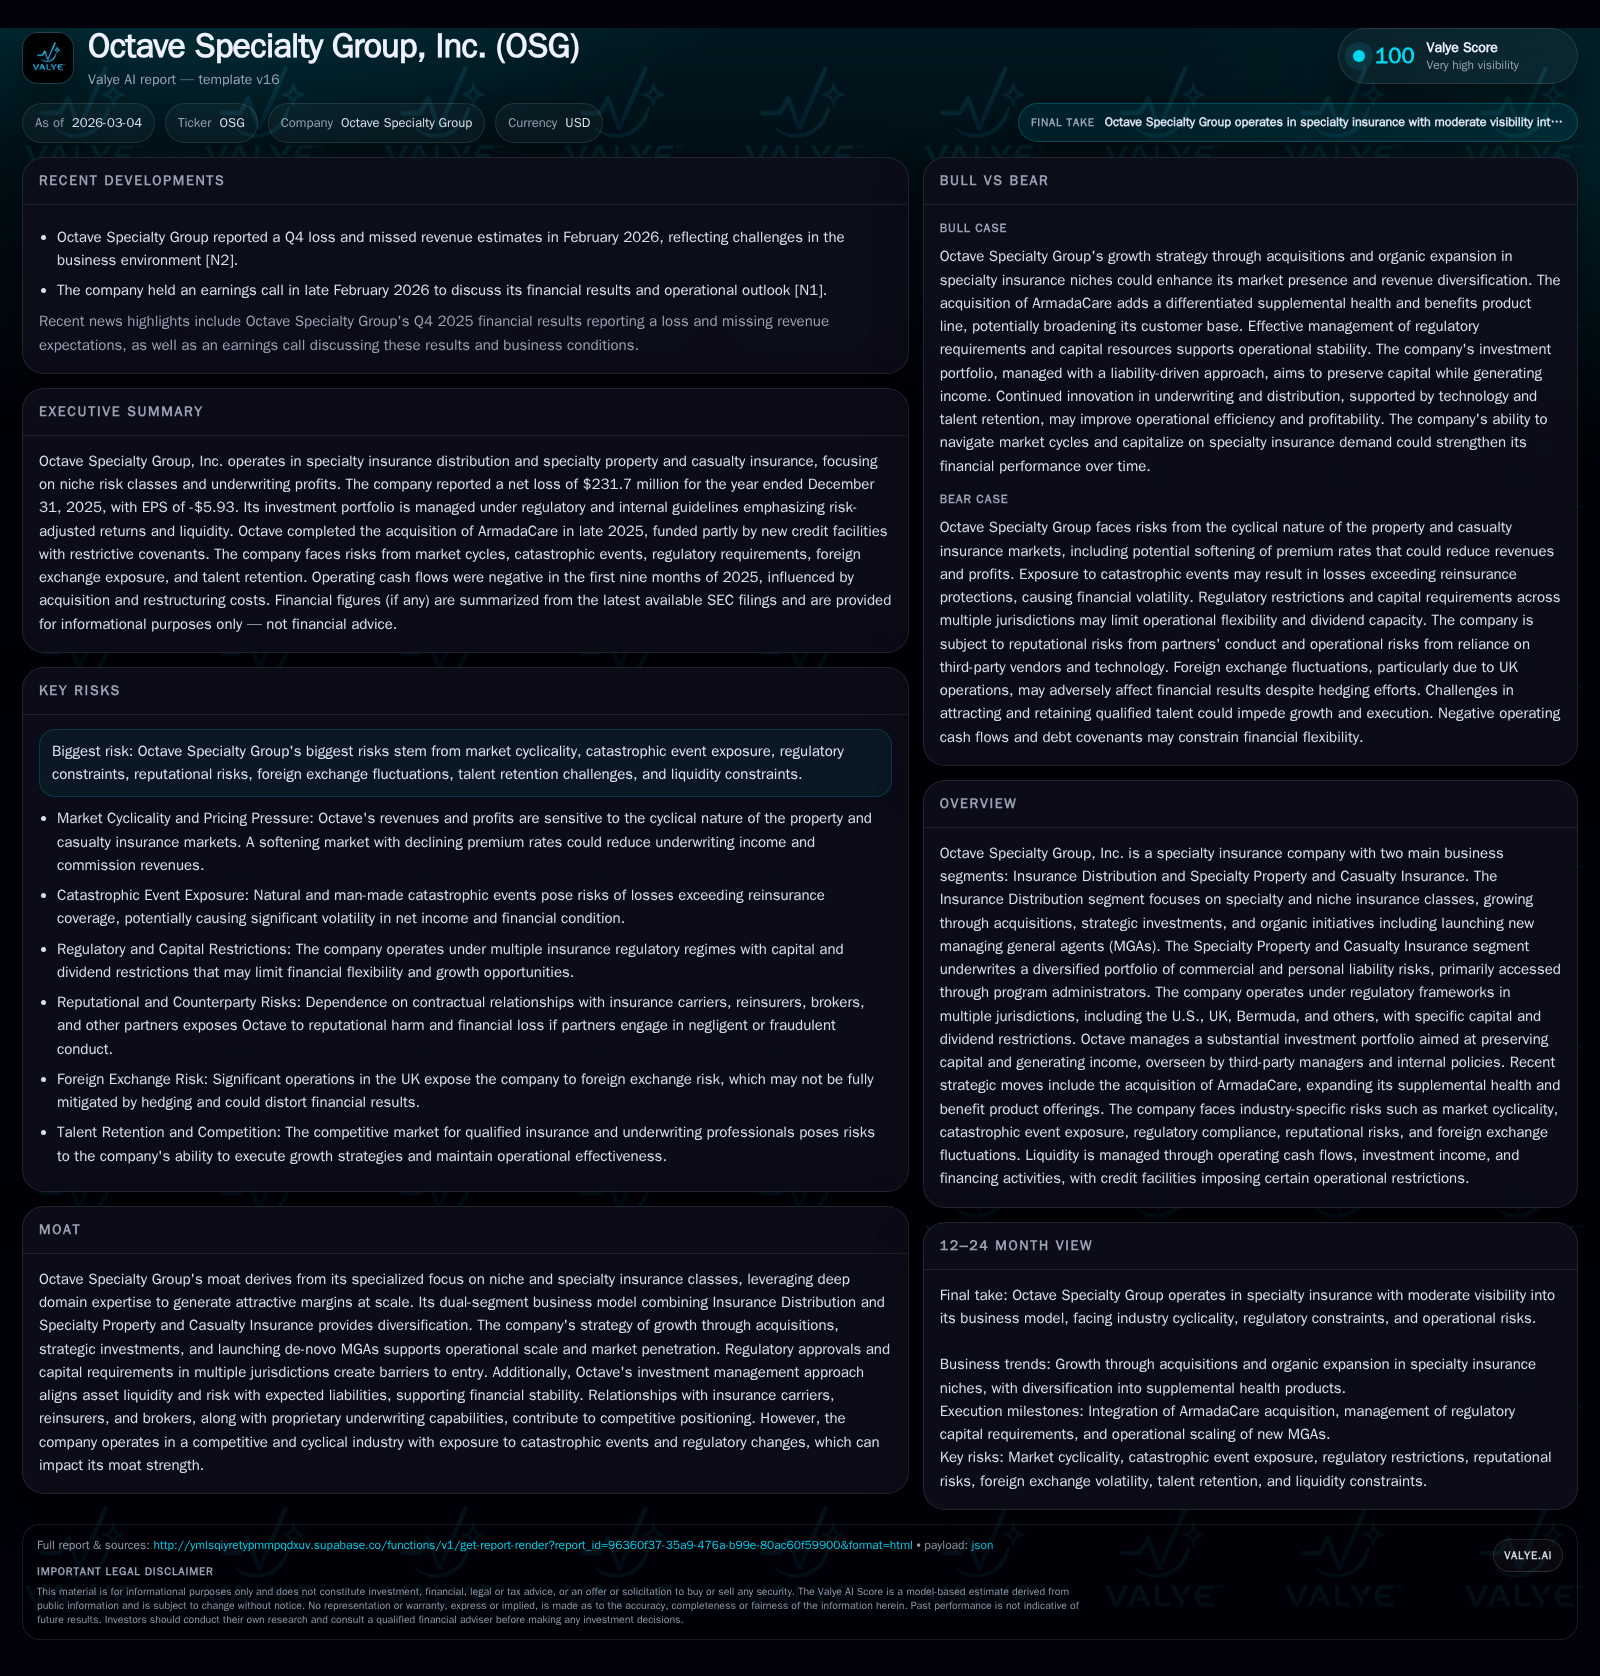
Octave Specialty Group, Inc. operates through two distinct but complementary segments: Insurance Distribution and Specialty Property and Casualty Insurance. The company has pursued growth via acquisitions, strategic investments, and launching new MGAs while navigating the regulatory frameworks across multiple jurisdictions. Its financial performance in recent years has been mixed: revenues showed modest growth in 2025 following sharp declines from 2022 to 2024, while net losses markedly improved but remain substantial. Leveraging an extensive investment portfolio aligned with liability profiles, OSG faces capital allocation challenges exacerbated by significant indebtedness incurred in late 2025. Risk factors including market cyclicality, regulatory constraints, FX exposure, and talent competition add complexity to its strategic trajectory.
Company Overview and Business Model
Octave Specialty Group, Inc. operates primarily through two business segments: Insurance Distribution (ID) and Specialty Property and Casualty (P&C) Insurance [S1]. The ID segment focuses on distributing specialty and niche insurance classes which tend to generate attractive margins when scaled effectively. Growth here is driven by a combination of acquisitions (notably ArmadaCorp in late 2025), strategic investments, de novo MGA/MGU launches, and organic initiatives bolstered by a centralized technology-enabled shared services platform [S2]. Meanwhile, the Specialty P&C segment underwrites a diversified portfolio of commercial and personal liability risks accessed mainly through program administrators.
The combination of these segments allows OSG to diversify revenue streams while leveraging deep domain expertise within specialty underwriting niches—a source of strategic moat . Regulatory frameworks govern both segments across multiple domiciles including U.S. states (Arizona, Pennsylvania, Rhode Island), the U.K., Bermuda, among others [S1][S18]. These requirements impose capital standards, licensing mandates for MGA/Us, dividend restrictions, and necessitate close adherence to evolving insurance laws.
Historical Financial Performance
OSG's revenue trajectory illustrates volatility over recent years characterized by a stark contraction followed by modest recovery. Revenues fell dramatically from $505 million in FY2022 to $236 million in FY2024 before rebounding approximately 6.5% to $251 million in FY2025 [F1]. Net income (loss) similarly moved from profitable levels ($522 million net income FY2022) into deep losses (-$548 million FY2024), improving somewhat to a loss of -$259 million in FY2025 but still reflecting significant operational challenges [F1].
Operating cash flows demonstrated pronounced swings—positive $1.335 billion in FY2022 scaled back substantially with negative cash flows reported historically but data for latest years is limited [F1]. Capital allocation reflects ongoing investments along with buybacks that increased materially to nearly $30 million in FY2025 from roughly $12 million prior year [F1]. Equity declined markedly since its peak at over $1.36 billion in 2023 to about $716 million at end-2025 indicating pressure on net asset base amid losses.
Historical performance (annual)
| FY | Rev ($mm) | Net ($mm) | CFO ($mm) | Rev YoY | Net YoY |
|---|---|---|---|---|---|
| 2025 | 251 | -259 | +6.5% | +52.7% | |
| 2024 | 236 | -548 | -12.3% | -13806.6% | |
| 2023 | 269 | 4 | 200 | -46.7% | -99.2% |
| 2022 | 505 | 522 | 1335 |
Source: SEC companyfacts cache [F1].
Capital returns and efficiency (annual)
| FY | Buybacks ($mm) | ROE% |
|---|---|---|
| 2025 | 30 | -36.2 |
| 2024 | 12 | -64.0 |
| 2023 | 5 | 0.3 |
| 2022 | 14 | 41.7 |
Source: SEC companyfacts cache [F1].
Revenue reflects continuation operations; net income variances affected by operational writes and impairments [F1].
Future Growth Prospects
OSG aims to enhance shareholder value through continued expansion of its ID business leveraging specialist knowledge of niche segments coupled with expanding its Specialty P&C underwriting footprint [S2][S26]. Growth levers include further acquisitions akin to the ArmadaCorp transaction which broaden geographic reach and product offerings. Importantly, launching new MGA/MGU platforms organically allows entry into emerging specialty lines backed by scalable centralized operations.
However, growth is subject to multiple constraints:
- Regulatory hurdles restrict ability to rapidly deploy capital or enter new markets.
- Competition for insurance underwriting talent heightens risk around attracting leaders essential for de novo MGAs.
- Market cyclicality and social inflation trends impact pricing power and reserve adequacy.
- Dependence on key capacity providers such as Lloyd’s Syndicate 4242 means any reduction in carrier appetite could constrict commission revenues [S12].
- Foreign exchange volatility may distort results given significant UK-based operations transacting largely in GBP against USD reporting currency [S7].
Technology adoption remains an implicit factor—failure to integrate modern analytics or AI tools cost-effectively could hinder competitive posture relative to more digitally advanced peers [S14].
Forecasts and Milestones
Explicit management guidance has not been publicly disclosed beyond strategic priorities emphasizing acquisitions, organic MGA launches, and margin improvement efforts [N1][N2][S2]. Key near-term milestones include integration progress of ArmadaCorp acquired in October 2025 supported by new credit facilities [S6][S9]. The operational effectiveness of this acquisition will be crucial both for revenue growth and meeting indebtedness servicing commitments.
Monitoring forward includes:
- Underwriting profitability trends within Specialty P&C;
- Commission growth trajectory within Insurance Distribution segments;
- Successful launch pace of new MGA/MGU entities;
- Maintenance of regulatory capital above required thresholds across jurisdictions;
- Management’s ability to retain critical underwriting talent;
- Effects of evolving regulation on operating costs.
Returns and Capital Allocation
OSG’s financial returns remain under pressure due primarily to elevated net losses although there was meaningful improvement between fiscal years ending December 31, 2024 and December 31, 2025. The approximate return on equity measured as net income divided by average equity stands at roughly -36% for FY2025 reflecting current operating challenges [F1].
On capital allocation:
- The company repurchased approximately $30 million of common stock during FY2025—a notable increase signaling confidence despite losses [F1].
- Dividends are constrained by regulatory capital requirements across insurance subsidiaries as well as credit facility covenants limiting restricted payments such as dividends or affiliate transactions [S4][S6][S15][S18].
- Cash flow data reflects constrained liquidity post significant acquisition spend; management aims to fund debt service principally from ID business cash generation though risks persist if earnings don’t materialize as forecasted [S6][S10][S20].
Liquidity, Capital Structure, and Debt Profile
The acquisition of ArmadaCorp was primarily financed through senior secured credit facilities totaling $120 million with a term loan ($100 million) plus revolving facility ($20 million), maturing five years post-closing [S6][S9]. These facilities carry restrictive covenants requiring maintenance of leverage ratios (e.g., consolidated total net leverage below four times) and fixed charge coverage minimums constraining financial flexibility.
Collateral securing these borrowings includes substantially all assets of the ID businesses plus equity interests therein; OSG guarantees these obligations at the parent level [S6][S24]. The company must maintain at least $10 million unrestricted cash at all times under the Credit Agreement adding liquidity buffer requirements [S9].
Failure to comply or refinance debt could necessitate asset sales or capital raises potentially dilutive or costly given market conditions—highlighting refinancing risk especially if ID business results weaken materially [S4][S20]. OSG also holds put options tied to redeemable minority interests that may require substantial future cash outlays causing further liquidity strain if exercised unexpectedly [S20].
Investment Portfolio Strategy
Total investments stood near $294 million at December 31, 2025 spread across corporate securities ($66.6m), U.S. government obligations ($35.4m), municipals ($11.6m), asset-backed securities ($3.8m), mortgage-backed securities ($4.9m combined), and short-term investments (~$146m) predominantly money market funds [S15][S24].
The portfolio is managed largely by third-party managers under guidelines emphasizing capital preservation aligned with liability cash flows following a liability-driven investment philosophy primarily for the Specialty P&C entities (e.g., Everspan insurance group) while the parent entity pursues income maximization subject to internal credit quality rules [S15]. This alignment aims to support long-term solvency while generating cash flow for claims payments.
Risk Factors Overview
OSG contends with multiple notable risks that could impact its financial health and operational execution:
- Market Cyclicality & Catastrophic Losses: Social inflation trends elevate claim severity complicating reserve setting; unexpected loss development could materially impair earnings or require additional capital.[S13][S19][S23]
- Regulatory Complexity: Multi-jurisdictional licensing regimes impose capital ratios limiting dividends/distributions; frequent regulatory inquiries increase compliance costs.[S11][S18]
- Operational Dependence & Litigation Exposure: MGA/U entities face potential errors & omissions claims; counterparty defaults threaten commission revenue streams.[S12][S22]
- Leverage & Liquidity Threats: Substantial debt load from recent acquisitions could limit financing options restricting growth or forcing asset disposals.[S6][S20]
- Foreign Exchange Volatility: Material U.K.-based operations expose results each period to GBP/USD fluctuations despite hedging programs.[S7]
- Talent Retention/Competition: Ability to secure skilled underwriting leadership for MGA launches critical yet increasingly challenging given industry competition.[S22]
- Reputational Risks: Adverse conduct by partners can lead to lost business prospects or reputational harm.[S19]
Conclusion
Octave Specialty Group is strategically focused on expanding its presence across specialty insurance niches through complementary Insurance Distribution and Specialty P&C businesses leveraging targeted acquisitions alongside organic platform creation efforts. Although revenue stabilization occurred recently following earlier contraction periods, ongoing substantial net losses reflect challenges balancing growth initiatives against escalating claim costs and operating expenses.
The company navigates complex multi-jurisdictional regulation that simultaneously acts as barrier-to-entry but curtails distribution flexibility including dividend payouts—a key consideration given recent leverage build via acquisition funding.
Capital allocation efforts show increased buybacks reflecting confidence tempered by prudence necessitated by existing secured credit facilities with tight covenants constraining discretionary spending power.
Going forward successful integration of acquisitions like ArmadaCorp, maintaining disciplined underwriting amidst social inflationary pressures, mastering recruitment/retention challenges for skilled leadership in MGAs/MSUs launches along with strong regulatory compliance will determine OSG's ability to improve profitability trajectory while sustaining organic growth momentum.
Disclaimer: This report is for informational purposes only based on publicly available data as of March 4th, 2026. It does not constitute investment advice or recommendations regarding Octave Specialty Group securities or any other financial instruments.
Disclaimer: This is research-only, informational analysis and not investment advice. It may include AI-generated interpretation and general industry context. Always verify important details using primary sources.
Comments