
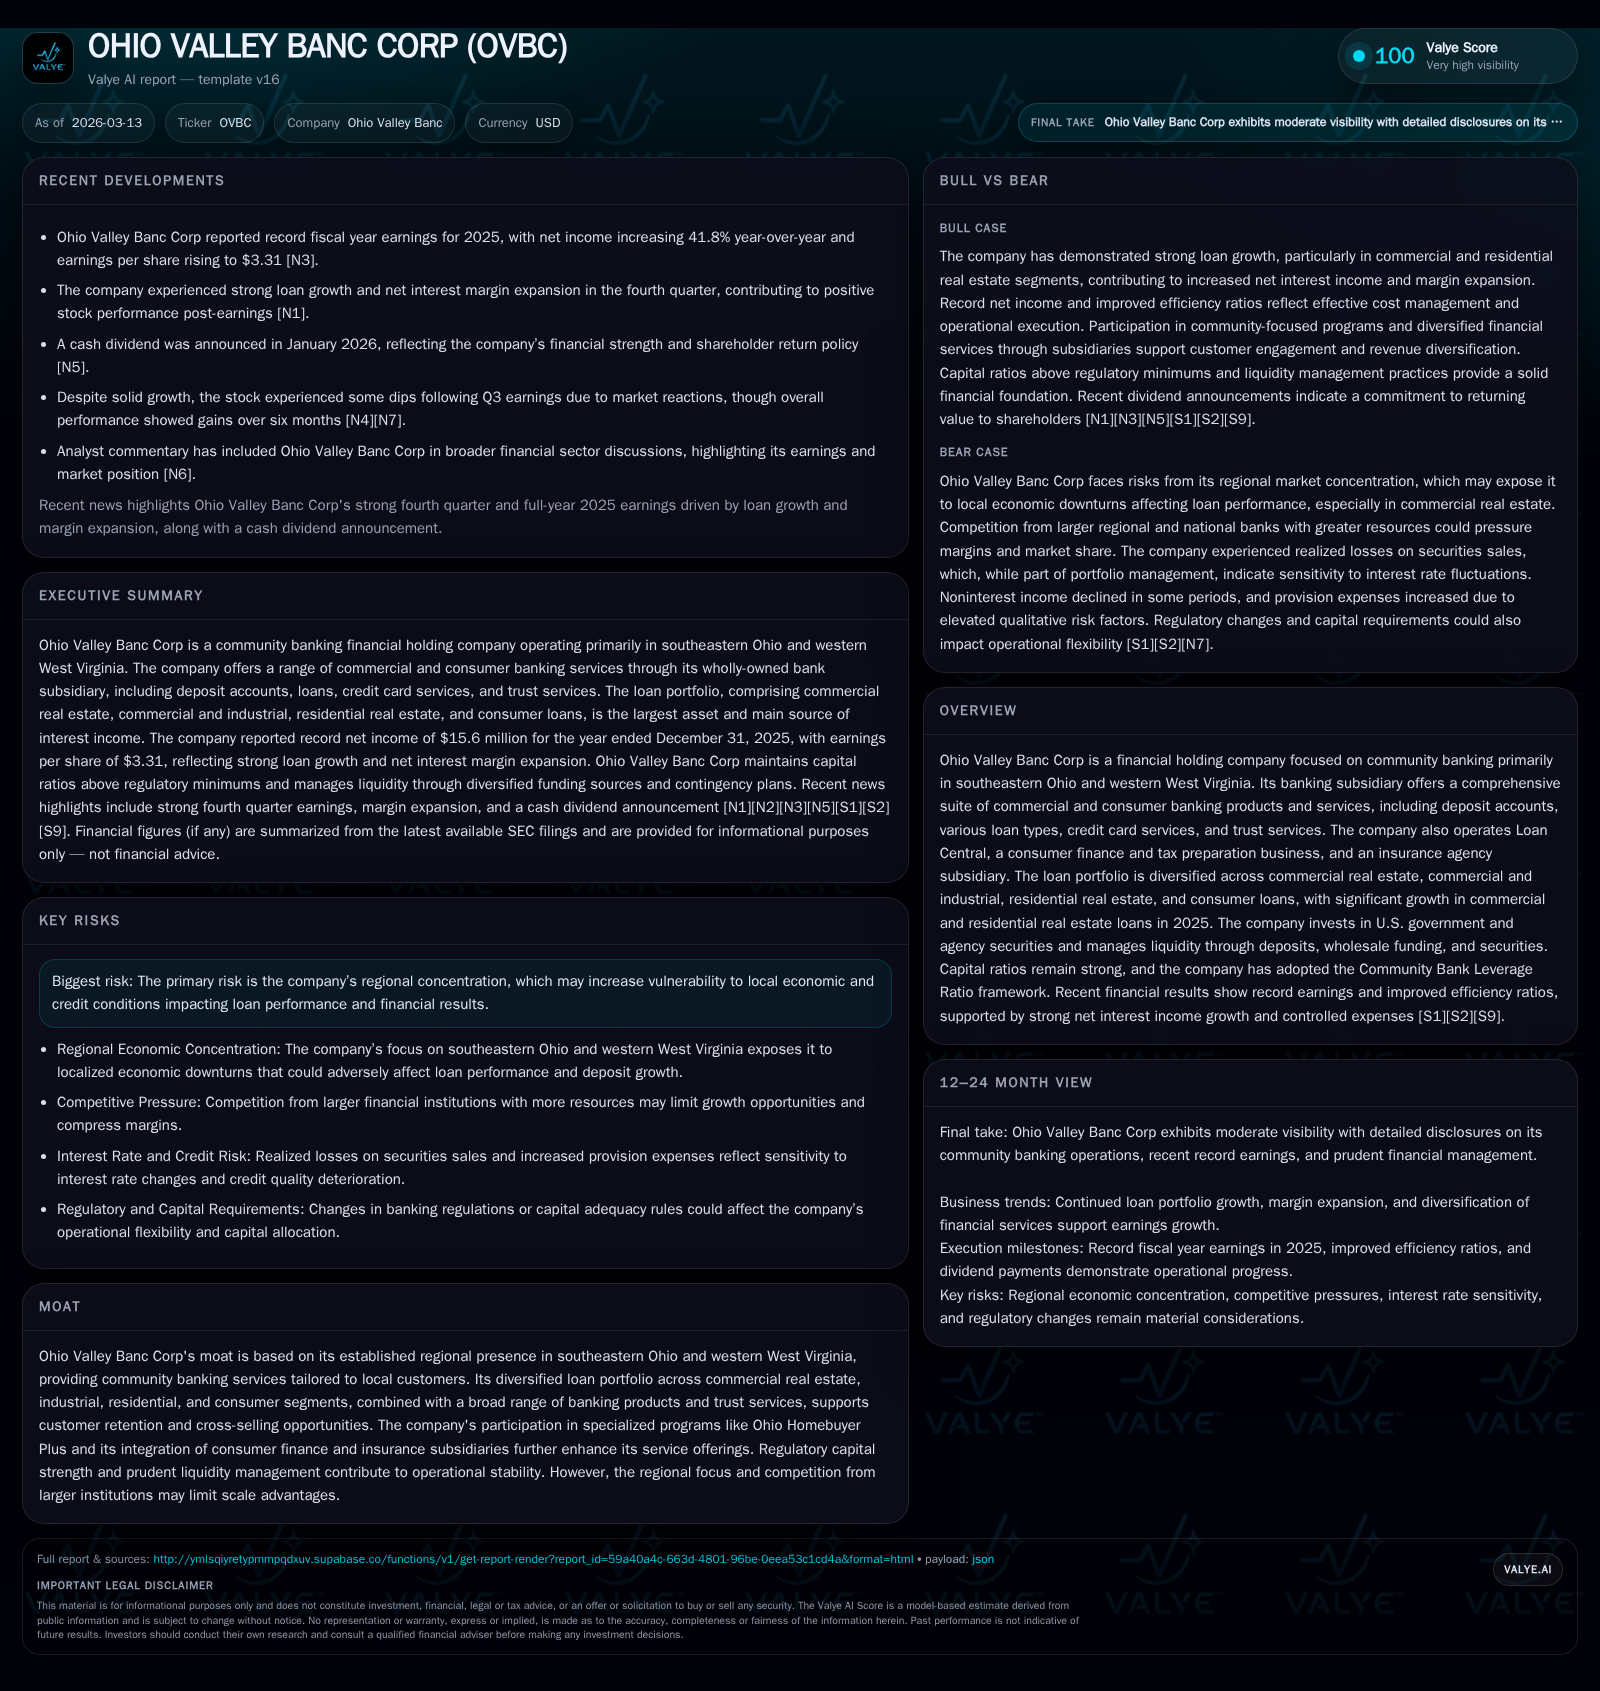
How Ohio Valley Banc Corp’s Regional Focus Shapes Its Growth and Capital Strategy
Ohio Valley Banc Corp leverages its concentrated regional banking operations and diversified loan portfolio to achieve significant growth while maintaining prudent capital management.
Ohio Valley Banc Corp delivered record earnings in fiscal year 2025 driven by notable expansion in its commercial and residential real estate loan portfolios alongside net interest margin improvement. The company's regional presence in southeastern Ohio and western West Virginia continues to underpin its community banking moat, though geographic concentration imposes credit risk dependencies on local economic conditions. Prudent liquidity management, strong regulatory capital compliance under the Community Bank Leverage Ratio framework, and consistent shareholder returns through dividends complement the company's financial profile. Observers should monitor ongoing loan portfolio quality, especially in commercial real estate segments, margin sustainability amid funding cost variability, and deposit dynamics in upcoming quarters.
Strong 2025 Growth: Drivers Behind Record Earnings
Historical performance (annual)
| FY | Net ($mm) | CFO ($mm) | Capex ($mm) | Net YoY |
|---|---|---|---|---|
| 2025 | 16 | 18 | 1 | +41.8% |
| 2024 | 11 | 13 | 1 | -12.9% |
| 2023 | 13 | 21 | 3 | -5.3% |
| 2022 | 13 | 16 | 2 |
Source: SEC companyfacts cache [F1].
Capital returns and efficiency (annual)
| FY | Buybacks ($) | FCF ($mm) | ROE% |
|---|---|---|---|
| 2025 | 0 | 17 | 9.2 |
| 2024 | 1945000 | 12 | 7.3 |
| 2023 | 82000 | 18 | 8.8 |
| 2022 | 14 | 9.9 |
Source: SEC companyfacts cache [F1].
Ohio Valley Banc Corp posted historic earnings for fiscal year 2025, with net income reaching $15.6 million—a notable increase of 41.8% over the prior year’s $11.0 million [F1]. This remarkable growth primarily stems from sizable increases in loan balances within the commercial and residential real estate sectors accompanied by an expansion of net interest margins (NIM). Specifically, the company’s consolidated commercial loan portfolio rose by approximately $105.7 million (19.9%), bolstered by new commercial real estate originations during the year [S1][N2]. Residential real estate loans grew $44.4 million (11.9%), influenced substantially by elevated short-term adjustable-rate mortgages amid a rising rate environment that curtailed long-term fixed mortgage volumes [S1][S16].
Simultaneously, OVBC improved operational efficiency as reflected in lower personnel costs against a backdrop of selective lending priorities emphasizing higher-yielding assets [N1][N2]. Net interest margin expanded to an estimated 4.03% year-to-date, up from roughly 3.71% in 2024, benefiting from both asset repricing dynamics and a strategic shift toward more economically efficient deposit products such as NOW, savings, and money market accounts [S24]. The reduction in reliance on wholesale funding further contributed to margin enhancement.
Loan Portfolio Evolution: Real Estate Momentum and Diversification
The company's loan portfolio now totals approximately $1.196 billion as of December 31, 2025—an increase of over $134 million since year-end 2024—with growth centered on the commercial real estate (CRE) and residential segments [S1][F1]. The carefully segmented CRE portfolio distinguishes owner-occupied versus non-owner occupied properties alongside exposures like construction loans, reflecting prudent underwriting tailored to community risk parameters [S6][S18]. Importantly, while commercial loans carry inherently higher credit risk than single-family residential mortgages or consumer loans due to business-concentration sensitivities, OVBC mitigates exposure via diversified industries across southeastern Ohio and western West Virginia without significant borrower concentration or foreign entity exposure [S1][S18].
After strategic unwinding of indirect automobile lending—largely unattractive due to dealer cost offsets—the consumer portfolio declined approximately 10%, including a steep drop (~21%) in automobile loans during the period; however, home equity lines recorded growth near 11.5%, better aligning with lending priorities focused on yield maximization [S16]. This portfolio repositioning underscores management’s emphasis on optimizing return on earning assets through selective asset mix adjustments.
Navigating Regional Market Nuances and Competitive Positioning
OVBC’s entrenched regional presence within predominantly rural and semi-urban communities affords it a moat rooted in established customer relationships deeply intertwined with local economies—a feature critical to community banking survival [S2]. Its footprint stretching across southeastern Ohio into western West Virginia caters to demographic cohorts often underserved by larger institutions’ scale-focused strategies.
Nevertheless, regional concentration inherently amplifies vulnerability to localized economic downturns or industry-specific headwinds impacting borrower ability to repay loans or maintain deposits [S2]. Competition from national or regional banks offering broader product suites or digital capabilities also challenges market share gains.
Regulatory capital adequacy remains reassuringly robust under the Community Bank Leverage Ratio (CBLR) approach adopted by OVBC, achieving a leverage ratio exceeding the qualifying threshold at approximately 10.18% as of Q3 2025; this protective buffer supports growth initiatives while ensuring regulatory compliance without undue burden from Basel III complexity for smaller banks [S23].
Future Opportunities and Headwinds in the Core Operating Regions
While Q4 earnings releases signal confidence from strong loan demand especially within CRE originations, macroeconomic uncertainties tied to local economic health pose principal constraints on growth potential ([N1], [N3], [S2]). Interest rate volatility may pressure margins if the pace of loan repricing fails to keep pace with wholesale funding cost escalation.
The company's participation in innovative programs like Ohio Homebuyer Plus—which incentivizes homebuyers through superior interest rates on designated "Sweet Home Ohio" accounts subsidized partially by Ohio's Treasurer's office—illustrates creative deposit-gathering efforts responding to competitive deposit pricing pressures within its markets ([S2]). Such programs may offer modest structural advantages if effectively scaled.
Nevertheless, risks surrounding credit quality warrant vigilance given the uptick in commercial real estate loans rated special mention or substandard status primarily tied to collateral-dependent credits or construction delays; no significant allowance adjustments have been deemed necessary so far but ongoing monitoring is essential ([S20]).
Capital Structure, Liquidity Management, and Risk Controls
OVBC funds its loan book primarily through core deposits encompassing demand deposits, savings accounts, money market deposits, NOW accounts, and certificates under $250k FDIC insured amounts ([S6], [S9]). Wholesale funding remains complementary at under approximately 12% of total assets as of September 30, 2025—a conservative proportion that mitigates refinancing risks even as Federal Home Loan Bank advances provide liquidity support against pledged collateral ([S9]).
Unrealized losses marked within available-for-sale securities portfolios do not currently impair liquidity given management intentions not to sell prior to cost recovery; these securities primarily include U.S. government sponsored entities and mortgage-backed instruments aligned with typical safe-harbor investment strategies ([S4], [S6]).
Liquidity stress testing frameworks are actively deployed through Asset Liability Committees incorporating forward-looking scenarios ensuring depositor withdrawal demands can be met without compromising solvency ([S7]).
Risk controls extend across credit underwriting disciplines with mandatory independent review processes for larger commercial loans exceeding delegated limits—segmenting unsecured exposures up to $1 million or secured ceilings—as well as committee approvals for exceptions beyond loan officer limits ([S6], [S18]).
Returns to Shareholders: Dividends, Buybacks, and Cash Flow Trends
OVBC demonstrates sustainable operating cash flow expansion highlighted by a rise from $13.1 million in FY2024 to approximately $18.1 million in FY2025—a gain nearing 38% year-over-year—while capital expenditures declined about 28%, resulting in a free cash flow generation close to $17 million for the fiscal year ([F1]). This robust cash generation supports steady dividend policies aligning with community bank profiles where capital preservation balances return considerations ([F1])[S7].
No share repurchases were executed during fiscal year 2025 compared with modest buybacks ($1.95 million) made in the prior fiscal year reflecting cautious capital deployment prioritized for balance sheet support amid growth phases ([F1]).
ROE remained around a moderate yet respectable level approximated at 9.2% given equity growth trajectories hitting $170 million at year-end December 31, 2025 from $150 million one year prior ([F1]), reflective of stable profitable operations though constrained by regional scale.
Key Metrics to Watch in Upcoming Quarters
In absence of explicit forward guidance beyond Q4 commentary ([N1]), investors should track several operational barometers:
- Continuation of loan origination momentum especially in commercial and residential real estate categories,
- Net interest margin trends vis-à-vis evolving deposit pricing and wholesale funding costs,
- Asset quality evolutions measuring nonperforming loans ratios and changes in special mention/substandard classifications,
- Deposit mix dynamics including inflows into specialized programs like Ohio Homebuyer Plus which may affect liquidity costs,
- Regulatory capital adequacy updates per quarterly filings underpinning risk buffers amidst growth pursuits. Monitoring these will clarify whether recent robust performance consolidates into sustained trajectory amidst regional economic contingencies.
This analysis is based solely on information publicly available as of March 13, 2026; it is intended for informational purposes without investment recommendation or opinion regarding Ohio Valley Banc Corp securities.
Disclaimer: This is research-only, informational analysis and not investment advice. It may include AI-generated interpretation and general industry context. Always verify important details using primary sources.
Comments