
Procter & Gamble’s Strategic Levers Drive Volume-Led Sales Expansion in Q3 2026
P&G’s Q3 2026 results showcase robust volume-driven organic growth amid margin pressures from cost headwinds and product mix.
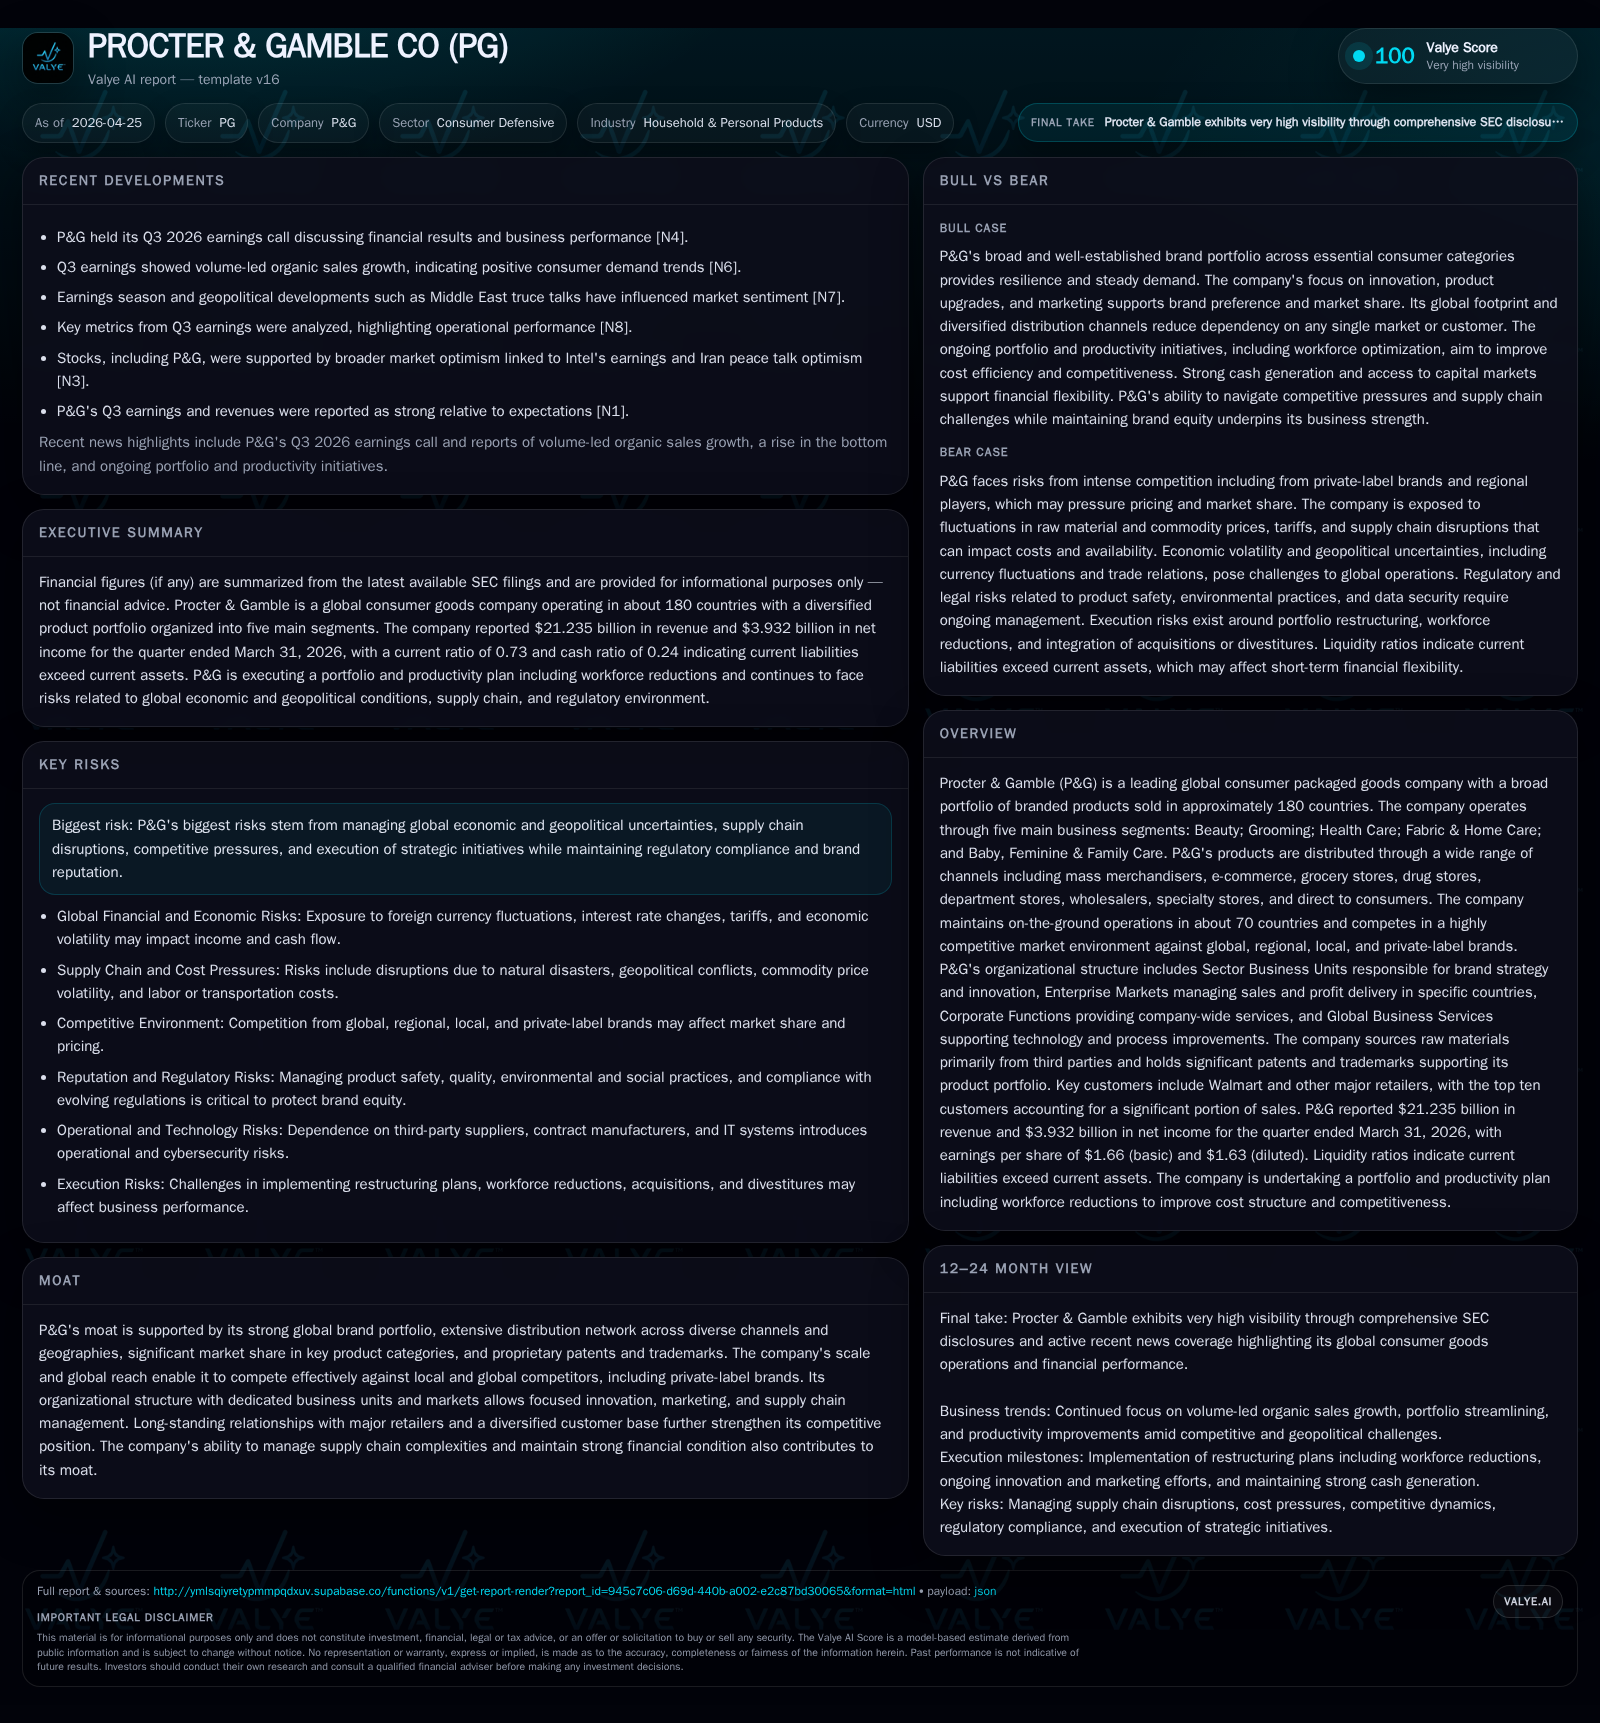
Procter & Gamble reported a stronger-than-expected Q3 2026 with 3% organic sales growth led predominantly by volume gains, underscoring demand resilience across its broad branded portfolio. Despite ongoing inflationary input costs and investments in brand and packaging innovation weighing on gross margins, P&G’s operational discipline and scale advantages supported profitability improvements. The company’s diversified global footprint combined with multi-channel distribution preserves competitive moats while innovation pipelines and emerging market momentum remain key growth catalysts. Investors should watch for execution progress on restructuring initiatives, margin recovery, and updated guidance in coming quarters.
Q3 2026 Operating Update: Volume-Led Growth and Cost Management
P&G’s latest quarterly filing for Q3 FY26, dated April 24, 2026 [S2], reveals a strong operating performance driven by volume-led organic sales growth of approximately 3%. The company explicitly highlighted that this growth was predominantly volume-driven rather than price-driven, indicating sustained consumer demand across its core product categories despite macroeconomic headwinds. Gross margin contracted by about 70 basis points versus the prior year quarter due mainly to an unfavorable product mix (100 bps impact), inflationary pressures on commodity raw materials (around 30 bps), and packaging investments (70 bps) [S2][S14]. These pressures were partially offset by productivity savings and pricing actions.
Management’s commentary in the accompanying earnings call transcript [N3] underlined ongoing focus on cost discipline and supply chain resilience amid volatility in energy costs and geopolitical risks such as trade tensions. P&G reiterated confidence in its full-year guidance while noting caution around near-term input cost fluctuations. Operational efficiencies from ongoing restructuring initiatives targeting overhead reductions are expected to mitigate some margin compression going forward.
This Q3 performance underscores P&G's capability to leverage scale and brand strength to sustain unit volume growth even when pricing power is moderated by competitive forces.
Business Model Analysis: Diverse Portfolio Serving Global Household Needs
P&G operates through five core business segments as detailed in its FY25 annual filing [S1]: Beauty; Grooming; Health Care; Fabric & Home Care; Baby, Feminine & Family Care. This multi-category presence allows it to address daily consumer needs comprehensively — from cosmetics to health products to household cleaning essentials. Its extensive brand portfolio includes marquee names commanding leading market shares globally.
Distribution is highly diversified encompassing mass merchandisers (e.g., Walmart), e-commerce including social commerce channels, grocery chains, drugstores, membership clubs, specialty stores including airport duty-free outlets, direct-to-consumer platforms and professional channels [S1][S23]. This omnichannel approach grants P&G coverage across traditional retail footprints alongside rapidly growing online consumer touchpoints.
Unit economics benefit from scale advantages: fixed overheads are spread over large volumes; marketing investments leverage global campaigns shared across brands; procurement efficiencies reduce input costs. The company also emphasizes innovation-driven product differentiation serving premiumization trends particularly visible in Beauty and Health Care verticals [S1][S6].
Enterprise Markets teams tailor execution strategies regionally enhancing responsiveness to local consumer preferences while maintaining synergy with sector business units driving brand-level innovation. This matrix organizational design supports both centralized efficiency and local market agility.
Industry Competitive Landscape: Differentiation through Scale and Brand Equity
The consumer packaged goods industry is intensely competitive with players ranging from global conglomerates to regional operators to private-label brands backed by retailers. P&G’s moat rests on several pillars noted in the Valye report excerpt:
- Strong global brand equity safeguarding customer loyalty.
- An expansive distribution network across approximately 180 countries allowing market breadth unmatched by many competitors.
- Significant economies of scale enabling cost competitiveness and marketing muscle.
- Robust R&D pipeline protected through patents & trademarks ensuring innovation leadership.
- Deep-rooted relationships with major retailers facilitating favorable shelf placement and trade terms.
While private labels exert pricing pressure especially in developed markets where consumers are more price sensitive, P&G counters this with continuous new product introductions targeting premium segments where consumers are willing to pay for quality or sustainability features [S1].
Regulatory compliance demands—ranging from FDA oversight to evolving sustainability standards—serve as additional entry barriers strengthening incumbents’ positions [S11][S12]. Nonetheless, geopolitical factors such as tariff uncertainties represent ongoing challenges requiring agility in supply chain configurations.
Growth Drivers: Innovation, Channel Expansion, Emerging Markets Momentum
Growth catalysts for P&G emerge structurally rather than purely cyclical. Product innovation geared toward consumer health & wellness trends fuels premium segment expansion across Beauty and Health Care units. For instance, higher-margin skin care lines benefit from demographic shifts emphasizing personal care investment [S1]. Packaging innovations aimed at sustainability align with evolving regulatory mandates and eco-conscious consumers enhancing brand resonance.
Channel diversification is another driver: rapidly growing e-commerce channels—including social commerce—offer higher engagement opportunities though require nuanced marketing approaches [S1][S23]. The company’s direct-to-consumer platforms enable enhanced data capture empowering personalized offerings.
Geographically, emerging markets remain vibrant growth engines with high single- to low double-digit sales increases reported recently in Latin America and parts of Asia. Rising disposable incomes combined with urbanization support increasing penetration of modern retail formats where P&G commands share gains [S2][S22]. This offsets slower mature-market volume expansion thus balancing overall top-line trajectories.
Growth Constraints: Inflationary Pressures and Geopolitical Risks
P&G faces meaningful cost headwinds from inflation impacting key raw materials such as chemicals, energy inputs for manufacturing processes, plus packaging components [S2][S14]. The company invests heavily in supply chain optimizations but remains exposed to commodity price swings outside its control leading to margin pressure alongside price elasticity constraints imposed by competition.
Geopolitical risks including trade tariffs, sanctions variability across regions (e.g., Middle East tensions), currency volatility, and supply interruptions due to weather or conflict pose notable unpredictability to operational continuity [S2][S11][S22]. While risk management mitigations exist—including multi-sourcing strategy—the complexity elevates exposure relative to less globally integrated peers.
Regulatory compliance costs continue rising particularly related to environmental approvals, emissions standards (notably noted by UK site permit issues) plus labor/social governance requirements imposing additional expense layers [S11][S12].
What To Watch: Upcoming Guidance, Execution Milestones, Demand Indicators
Key near-term focus areas include monitoring management’s updates on FY26/FY27 guidance especially margin trajectory amid fluctuating input costs highlighted in the recent earnings call [N3]. Progress on restructuring efforts targeting up to $2 billion pre-tax savings over two years with overhead personnel reductions up to 7,000 planned by end FY27 will be critical for sustaining margin recovery [S21].
Demand indicators from emerging markets’ organic volume growth rates will reveal resilience against inflationary impacts. Similarly, digital channel sales velocity—an increasingly important vector—needs ongoing scrutiny for signs of customer adoption acceleration or bottlenecks [S2][N3].
Trade term negotiations with major retail partners remain a variable warranting observation given concentration risks; shifts could materially impact gross margins per historical patterns [S23].
Finally, any updates around geopolitical/regulatory developments influencing supply chains or raw materials availability could affect operational flexibility requiring swift adaptation.
Financial Overview: Supporting Evidence from Latest Quarterly and Annual Data
Historical performance (annual)
|
| FY | Rev ($bn) | Net ($bn) | CFO ($bn) | OpInc ($bn) | Rev YoY | Net YoY |
|---|---|---|---|---|---|---|
| 2025 | 84.3 | 16.0 | 17.8 | 20.5 | +0.3% | +7.4% |
| 2024 | 84.0 | 14.9 | 19.8 | 18.5 | +2.5% | +1.5% |
| 2023 | 82.0 | 14.7 | 16.8 | 18.1 | +2.3% | -0.6% |
| 2022 | 80.2 | 14.7 | 16.7 | 17.8 |
Source: SEC companyfacts cache [F1].
Capital returns and efficiency (annual)
|
| FY | Div ($bn) | Buybacks ($bn) | FCF ($bn) |
|---|---|---|---|
| 2025 | 9.9 | 6.5 | 14.0 |
| 2024 | 9.3 | 5.0 | 16.5 |
| 2023 | 9.0 | 7.4 | 13.8 |
| 2022 | 8.8 | 10.0 | 13.6 |
Source: SEC companyfacts cache [F1].
A compact view of select financial metrics extracted from the latest filings ([S2], annual data from [F1]) illustrates the backdrop supporting P&G’s operational narrative:
|
| FY / Q | Revenue (USD bn) | Op Income (USD bn) | Net Income (USD bn) | CFO (USD bn) | Capex (USD bn) | Dividends Paid (USD bn) | Buybacks (USD bn) | Rev YoY % | OpInc YoY % | Net YoY % |
|---|---|---|---|---|---|---|---|---|---|---|
| FY2025 | 84.28 | 20.45 | 15.97 | 17.82 | 3.77 | 9.87 | 6.50 | +0.3% | +10.3% | +7.4% |
| FY2024 | 84.04 | 18.54 | 14.88 | 19.85 | 3.32 | 9.31 | 5.01 |
The slim top-line growth mask stronger operational leverage visible in double-digit operating income improvement reflecting productivity gains mitigating inflationary impact despite lower cash flows versus prior year largely due to working capital timing differences [F1],[S2]. Dividend growth has been consistent for decades with recent CAGR ~5%, underpinning shareholder return attractiveness backed by robust free cash flow generation supporting continued share repurchases aligning capital return with earnings growth strategies [S4],[F1].
Overall ROE at approximately 30% underscores efficient capital use reflective of sustained competitive moats leveraged through scale advantages and brand strength [F1]. Continued emphasis on cost efficiencies coupled with innovation-driven revenue enhancements remains pivotal for maintaining these favorable financial metrics amid volatile external conditions.
Disclaimer: This analysis is provided for informational purposes only based on publicly filed SEC documents and does not constitute investment advice or a recommendation regarding any securities.
Disclaimer: This is research-only, informational analysis and not investment advice. It may include AI-generated interpretation and general industry context. Always verify important details using primary sources.
Comments