
PG&E Corp Advances Capital Investments While Managing Regulatory and Wildfire Risks
Q1 2026 results highlight steady revenue growth and ongoing infrastructure investments amid regulatory scrutiny.
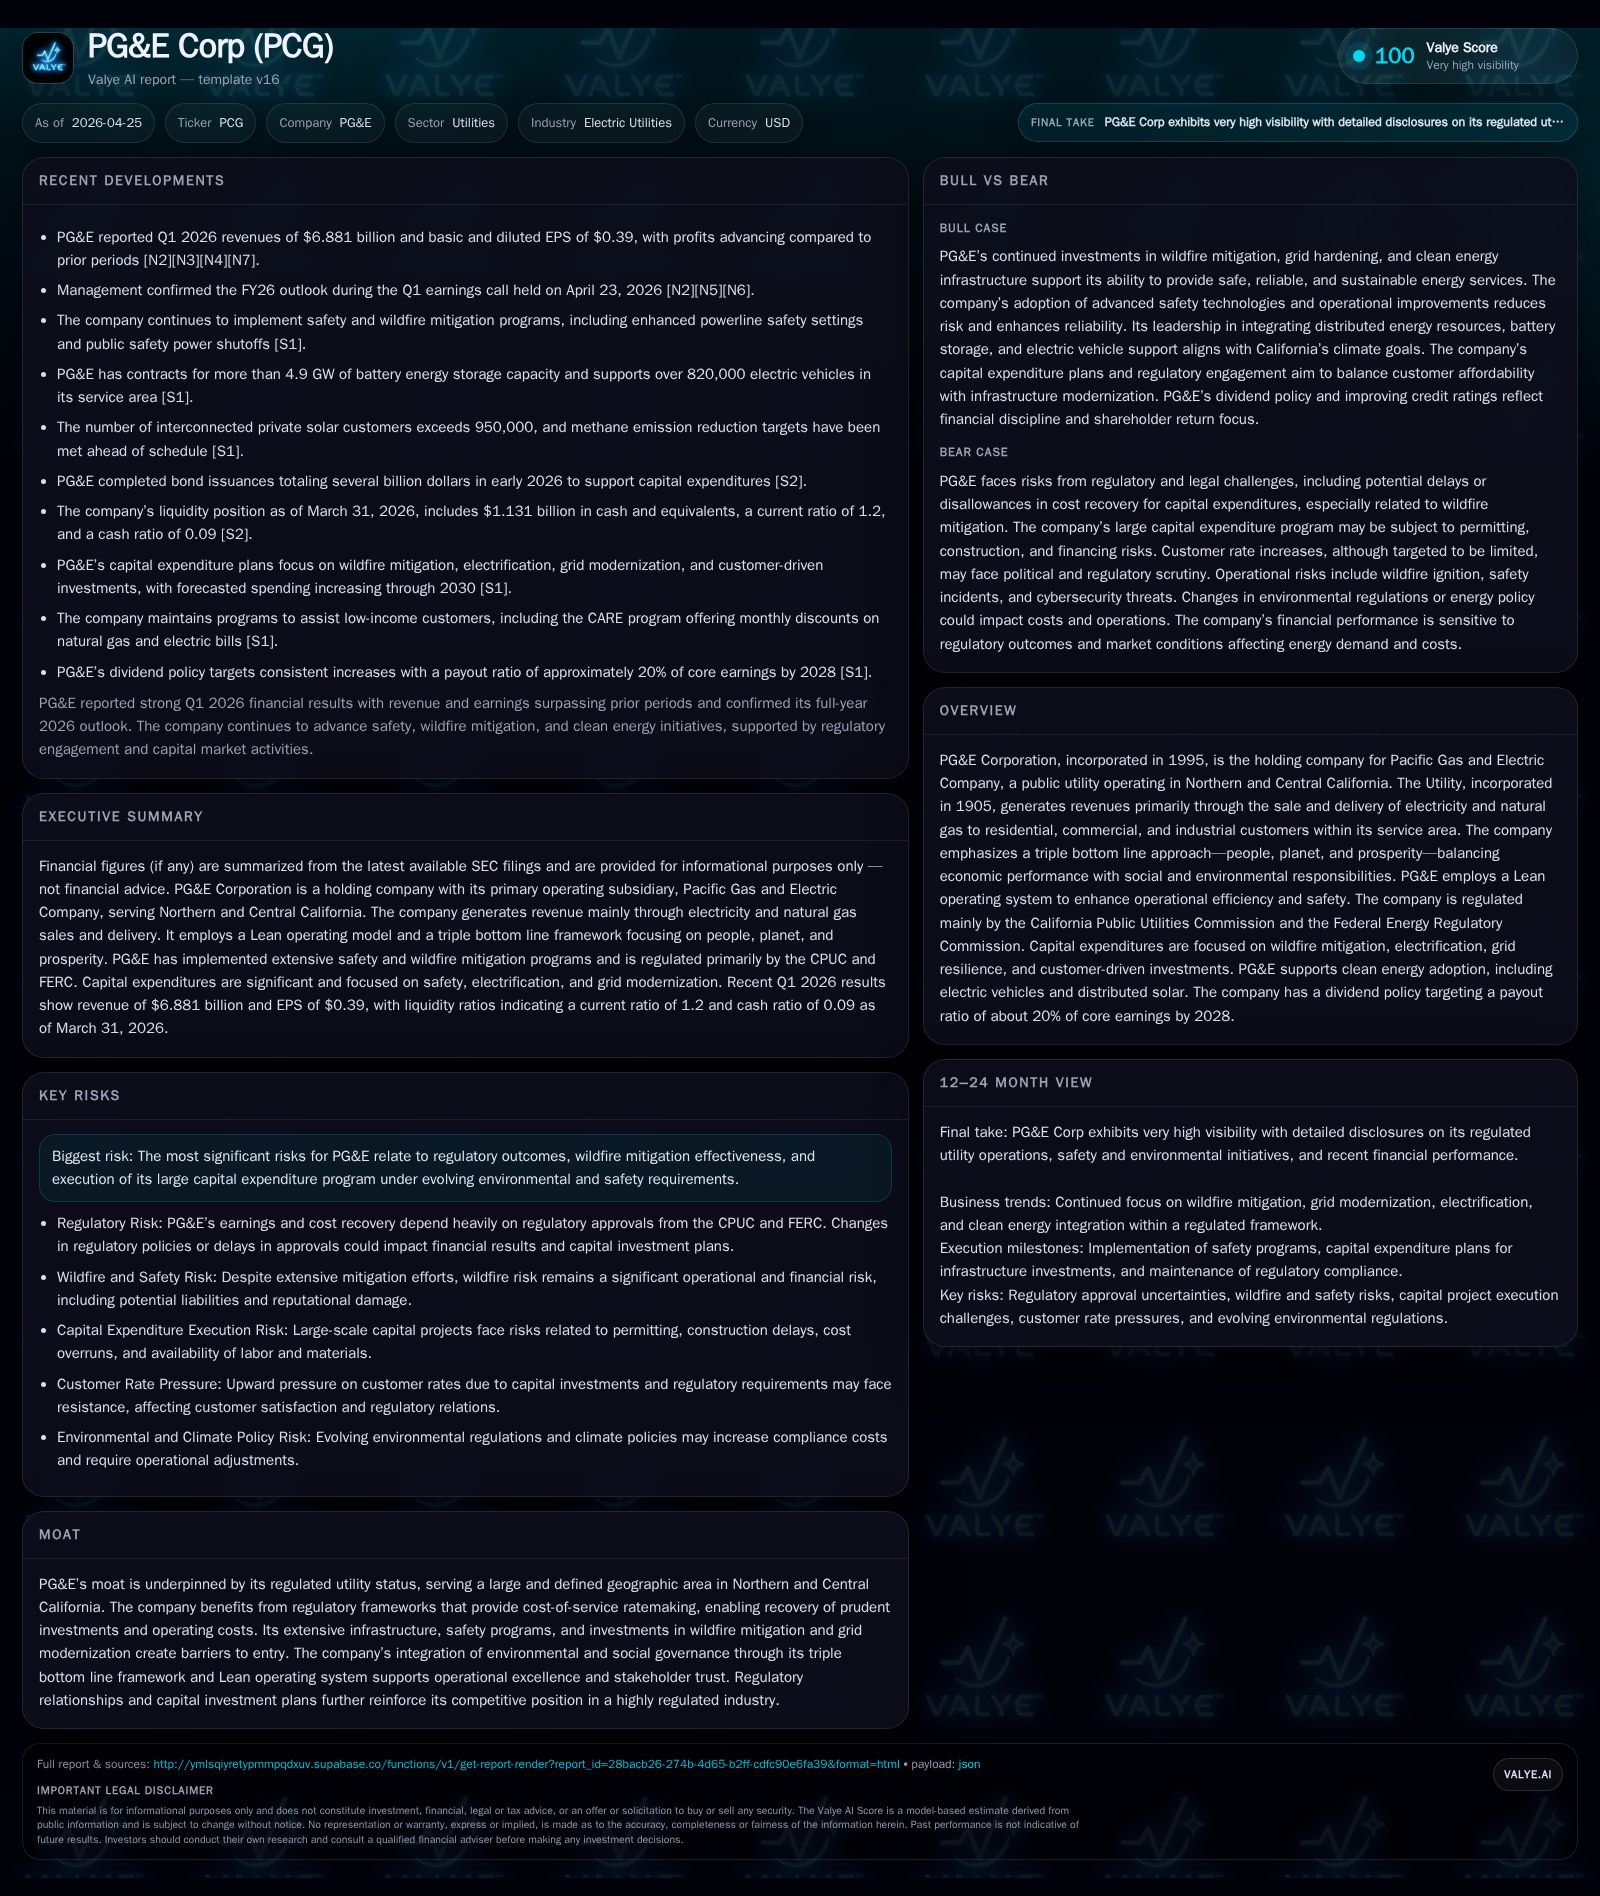
PG&E Corporation’s latest quarterly filing reveals incremental revenue growth alongside substantial capital expenditures focused on wildfire mitigation and grid modernization. The company operates within a tightly regulated framework that both constrains and supports its utility model, with safety certifications and regulatory approval critical to limiting wildfire liability. PG&E's business strategy balances operational efficiency improvements through Lean methodologies with ambitious sustainability goals to accommodate California’s evolving energy demands. Key growth drivers include electrification trends, renewable integration, and system resilience initiatives, while regulatory risks and capital-intensive undertakings remain significant constraints.
Recent Operating Update
PG&E Corporation’s Q1 2026 10-Q filing reveals that the company continues to post solid financial performance with revenues increasing year-over-year and surpassing consensus estimates [S2][N2][N3]. The growth correlates with expanding electricity and natural gas deliveries within its Northern and Central California footprint. Alongside strong top-line momentum, the quarter underscores sustained investment in wildfire mitigation efforts and grid resilience enhancements—critical priorities for the utility amidst ongoing environmental challenges.
Regulatory oversight remains central to PG&E’s near-term operational landscape. The company's ability to maintain an approved Wildfire Mitigation Plan (WMP) and valid safety certification from California’s Office of Energy Infrastructure Safety (OEIS) is pivotal. This certifies eligibility for protections under California Assembly Bills 1054/254 that cap wildfire liabilities—failures here could expose PG&E to significant financial risk through shifts in prudency burdens or disallowance of costs associated with catastrophic wildfires [S1][S25].
The Q1 report also reiterates key strategic commitments to climate adaptation efforts by integrating forward-looking climate data into operational planning—a segment of its wide-ranging triple bottom line focus encompassing people, planet, and prosperity metrics [S1][S14].
Business Model
PG&E Corp functions as a holding entity primarily serving as the umbrella for Pacific Gas and Electric Company—the regulated utility delivering electricity and natural gas across large swaths of Northern and Central California [S1][S8]. Its revenues derive fundamentally from volumetric sales combined with transmission/delivery charges approved by regulators.
Critical to the model is the cost-of-service ratemaking regime enforced by the California Public Utilities Commission (CPUC) alongside Federal Energy Regulatory Commission (FERC) oversight. This framework mandates transparent cost recovery for prudent investments while incentivizing reliability and safety enhancements through performance incentives [S1][S6]. Regulatory approval gates capital expenditure implementation tightly.
Strategically, PG&E integrates Lean operating principles to drive efficiency across operations, focusing on daily visibility into metrics via visual management tools, standardized work practices, continuous problem-solving cycles, waste elimination, and rigorous operating reviews. These measures aim to enhance responsiveness to safety risks and improve cost control—all vital given the complexity of managing a sprawling energy infrastructure amid heightened environmental hazards [S1][S14].
Industry Structure and Competitive Position
The utility operates in a classic regulated monopoly environment unique in its legal protections yet exposed to stringent regulatory compliance requirements. PG&E’s service territory encompasses over half of California’s population centers thus securing an entrenched customer base through distribution network exclusivity.
Barriers to entry are substantial owing to high capital intensity for infrastructure buildout coupled with rigorous state-level environmental mandates mandating proactive wildfire mitigation measures such as undergrounding lines or installing advanced weather monitoring technologies [S4][S15]. The integrated nature of transmission, generation assets (including owned hydroelectric facilities), energy storage contracts (~4.9 GW battery capacity), plus engagement with distributed energy resources fortifies PG&E’s competitive moat against potential challengers or alternative service providers [S8][S14].
However, this status does not immunize PG&E from reputation risks tied to historical wildfire incidents or recent regulatory scrutiny that have triggered upgrades in safety governance frameworks including enhanced cybersecurity oversight led by dedicated committees [S20].
Growth Drivers and Constraints
Structural demand catalysts reside firmly in California’s aggressive policy push toward electrification encompassing broad EV adoption (currently over 820K vehicles in PG&E’s territory), building electrification initiatives limiting fossil fuel use indoors, renewable integration targets demonstrating increasing solar plus battery storage deployments (>950K private solar customers), plus grid modernization programs aimed at enhancing resilience against wildfires or climate-driven natural hazards [S14][S6]. These evolving load profiles yield incremental volumetric increases while also necessitating capital spending on system upgrades.
On the other hand, growth is constrained by several interlocking factors:
- Regulatory Timeline Uncertainties: CPUC approvals impact pace of rate base additions; cost-recovery deferrals can compress near-term earnings.
- Capital Intensity: Forecasted capital expenditures exceed $12 billion for 2026 alone—sustained deployment requires disciplined project execution amid labor/material supply chain uncertainties [S4][F1].
- Liability Exposure: Maintaining OEIS certifications is not only costly but necessary to mitigate wildfire-related liabilities capped under AB 1054/SB 254 statutes.
- Rate Affordability: Upward pressure on customer bills from increasing investments must be balanced with equity concerns supported by CARE low-income programs aiming at bill relief.
Execution risk therefore remains elevated given these crosscurrents despite stable demand fundamentals.
What to Watch Next
Investor interest should focus tightly on several upcoming developments:
- Submission status and subsequent approval process of PG&E’s 10-year Electric Undergrounding Plan that entails significant underground infrastructure transitioning aimed at wildfire risk reduction [S4].
- Updates from OEIS concerning safety certification renewals or modifications impacting liability protections.
- Regulatory docket outcomes evaluating prudency of recent capex spending or adjustments to rate design impacting various customer classes differently.
- Progress towards internal operational targets within Lean programs especially those linked to safety performance metrics that influence public perception.
- Quarterly earnings releases providing further color on load growth trajectories influenced by EV adoption rates along with fluctuating natural gas vs electricity consumption patterns.
Financial Profile
Historical performance (annual)
|
| FY | Rev ($bn) | CFO ($bn) | OpInc ($bn) | Capex ($bn) | Rev YoY |
|---|---|---|---|---|---|
| 2025 | 24.9 | 8.7 | 4.7 | 11.8 | +2.1% |
| 2024 | 24.4 | 8.0 | 4.5 | 10.4 | -0.0% |
| 2023 | 24.4 | 4.7 | 2.7 | 9.7 | +12.7% |
| 2022 | 21.7 | 3.7 | 1.8 | 9.6 |
Source: SEC companyfacts cache [F1].
Capital returns and efficiency (annual)
|
| FY | FCF ($bn) |
|---|---|
| 2025 | -3.1 |
| 2024 | -2.3 |
| 2023 | -5.0 |
| 2022 | -5.9 |
Source: SEC companyfacts cache [F1].
Analysis anchored in trailing full-year results from calendar 2025 draws a picture of steady progress amidst heavy reinvestment:
|
| FY | Revenue ($B) | Op Income ($B) | CFO ($B) | Capex ($B) | Equity ($B) | Rev YoY (%) | OpInc YoY (%) |
|---|---|---|---|---|---|---|---|
| 2025 | 24.94 | 4.75 | 8.72 | 11.79 | 32.54 | +2.1% | +6.5% |
| 2024 | 24.42 | 4.46 | 8.03 | 10.37 | 30.15 | +0% | +66% (vs ‘23) |
| -note: Net income data outdated; reported net income in early periods not comparable-[F1] |
Operating income grew modestly year-over-year reflecting effective cost management despite inflationary pressures on labor/materials linked closely with capital projects execution [F1]. Operating cash flow rose robustly (+8.5%) but free cash flow remains negative owing principally to the elevated capital expenditure profile required for mission-critical infrastructure enhancements (-$3 billion approximated) [F1].
Liquidity ratios stand sound with current assets outstripping current liabilities yielding a current ratio around 1.2 as of March quarter-end supported by $1.13 billion in cash equivalents ensuring buffer against short-term obligations despite debt levels last reported in previous years around $3.5 billion total—not confirmed materially changed but worth monitoring at next disclosures [F1][S2].[S3]
Dividend policy targeting gradual payout increases aiming at about a fifth of core earnings underlines commitment to shareholder returns balanced against reinvestment needs [S13]. Debt issuance activity evidenced earlier this year indicates active capitalization strategies supporting ongoing capex needs without undue immediate liquidity stress [S9][S16].
Disclaimer
This analysis is based on publicly available SEC filings including Q1 2026 reports along with associated news disclosures as cited but does not constitute investment advice or recommendations regarding PG&E Corporation securities.
Disclaimer: This is research-only, informational analysis and not investment advice. It may include AI-generated interpretation and general industry context. Always verify important details using primary sources.
Comments