
Procter & Gamble's Restructuring Efforts Amid Supply Chain and Inflation Pressures
P&G reports steady revenue growth while executing a multi-year portfolio and productivity plan to navigate cost pressures and competitive dynamics.
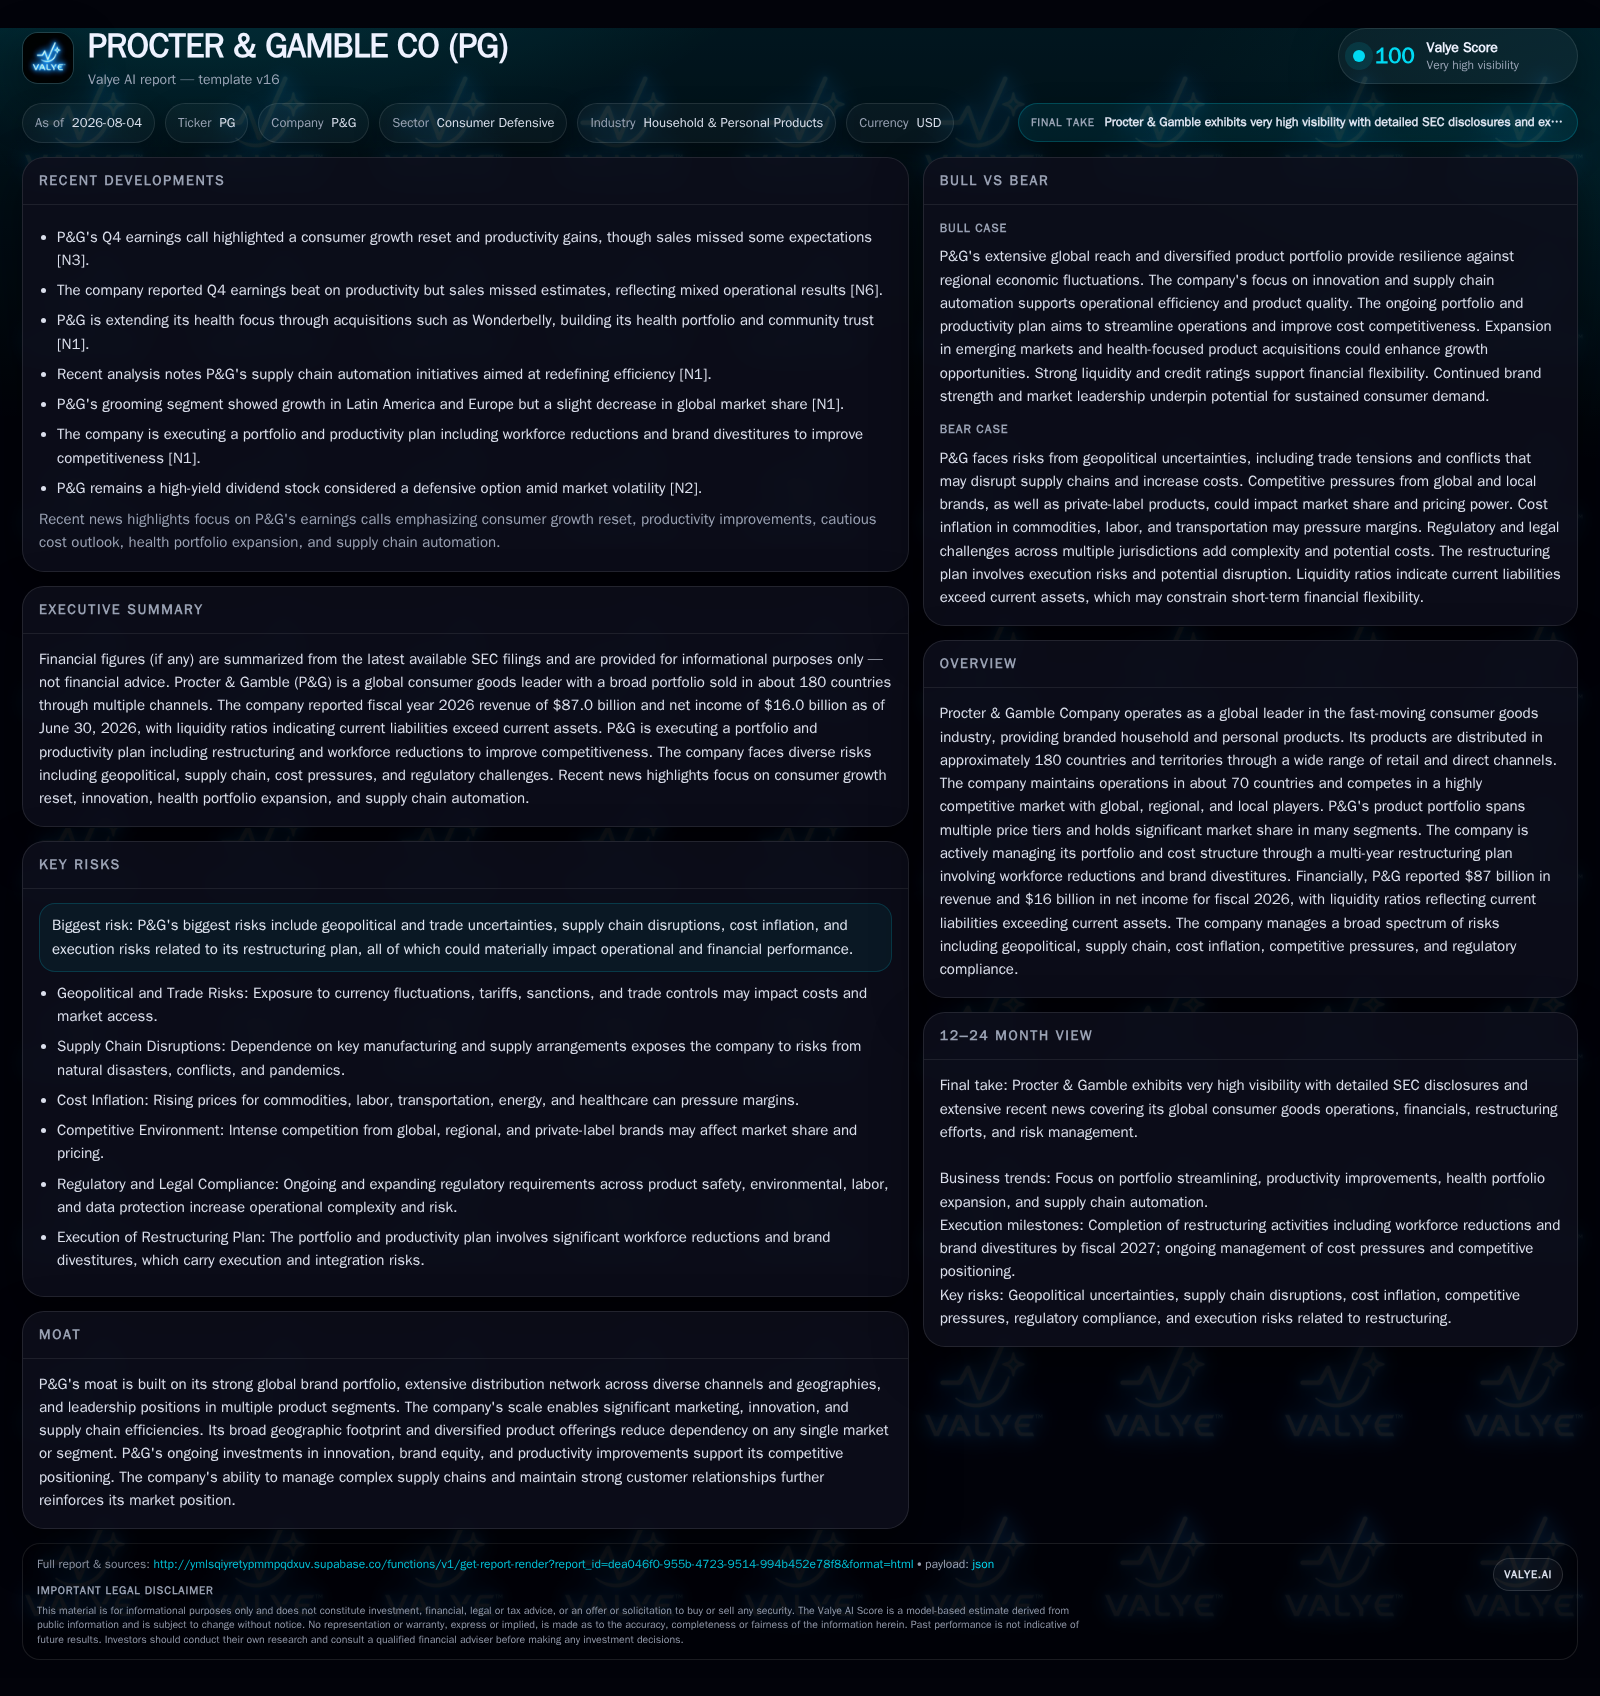
In its latest quarter ending June 2026, Procter & Gamble generated $87 billion in revenue with a net income of $16 billion, reflecting resilient demand despite ongoing macroeconomic headwinds. The company is managing cost inflation and supply chain challenges through an active restructuring program targeting workforce reductions and brand portfolio optimization. P&G’s broad geographic footprint and diversified product mix support its competitive positioning in a highly contested FMCG market. Key risks include geopolitical uncertainties, raw material cost volatility, and execution risks tied to operational restructuring efforts.
Recent Operating Update
Alongside financial results, P&G reaffirmed progress on its strategic restructuring initiative designed to enhance organizational efficiency and reduce overhead costs. The ongoing program targets approximately 7,000 non-manufacturing personnel reductions by the end of fiscal 2027 alongside planned divestitures within its brand portfolio aimed at focusing on higher-growth or higher-margin categories [S27][S28]. These measures reflect a proactive approach to recalibrating the company's operational model against fluctuating raw material prices, labor cost inflation, and evolving competitive dynamics.
Business Model
Procter & Gamble operates primarily as a multinational manufacturer and marketer of branded fast-moving consumer goods (FMCG), specializing in household cleaning agents, personal hygiene products, beauty care items, fabric care formulations, grooming supplies, and health-related consumables. With an extensive product portfolio spanning multiple price tiers across premium and value segments, revenue is generated through widespread distribution networks including mass merchandisers, grocery chains, drug stores, membership clubs (like Costco), specialty retail outlets (e.g., beauty stores), e-commerce platforms including social commerce channels, as well as direct-to-consumer sales [S27]
The company’s monetization strategy leverages its scale advantages—enabling substantial marketing spend to reinforce brand equity, driving consumer loyalty despite rising competition from private labels or regional brands. Revenue mechanics depend heavily on unit volume growth fueled by innovation pipelines introducing new product formulations or improved packaging solutions alongside measured price increases to manage input cost inflation without eroding demand elasticity [S1][S5]. Promotional incentives balanced with consistent trade terms maintain retailer buy-in while channel diversification mitigates concentration risk.
Margins are sensitive to commodity cost fluctuations—such as petrochemical derivatives used in packaging or active ingredients—and operational efficiency gains driven by supply chain optimization play a critical role in preserving profitability. Inventory turnover rates reflect tight working capital management amidst global logistics complexities. Customer retention metrics emphasize sustained engagement through quality consistency and brand trust.
Industry Structure and Competitive Position
The global Household and Personal Products industry remains intensely competitive with participants ranging from giant multinational conglomerates like Unilever, Colgate-Palmolive, Johnson & Johnson, Kimberly-Clark to numerous regional manufacturers offering localized products tailored to cultural preferences or price sensitivities. Private label brands have gained market share particularly among price-conscious consumers during economic downturns or markets with less brand loyalty [S16].
P&G’s competitive moat derives from its leading branding across flagship products (e.g., Tide laundry detergent, Pampers diapers), expansive geographic reach covering approximately 180 countries with localized operations in roughly 70 nations enabling nimble market response capabilities [S27]. This footprint affords scale economies in manufacturing procurement contracts as well as vast marketing distribution leverage that regional players struggle to match.
Strong innovation capabilities drive refreshed offerings sustaining market relevance; however, the industry’s low-margin nature demands rigorous cost control especially under rising raw material prices which compress gross margins universally. E-commerce penetration has accelerated channel shifts requiring flexible fulfillment infrastructures integrated with digital marketing strategies.
Growth Drivers
Top-line growth opportunities for P&G revolve around several key vectors. Expansion into emerging markets with growing middle-class populations provides volume upside amid increased consumption of branded hygiene and beauty products previously dominated by informal or private-label suppliers [N1]. Innovation investment continues focusing on product formulation advances enhancing sustainability credentials such as biodegradable ingredients or reduced plastic reliance aligning with shifting consumer preferences.
Multi-tier pricing strategies accommodate diverse income levels within single markets enabling premium variants to coexist with value options without cannibalization while maintaining overall category growth. E-commerce channels facilitate direct engagement accelerating consumer feedback loops that inform rapid product iteration.
Marketing effectiveness supported by significant advertising outlays preserves brand equity reinforcing customer loyalty crucial for retention in commoditized segments. Supply chain improvements targeting shorter cycle times mitigate inflation impact enhancing inventory turnover rates thus freeing capital for reinvestment.
Risks / Watchpoints / Growth Constraints
P&G faces significant exposures stemming from geopolitical volatility impacting supply chain resilience such as trade restrictions or tariffs affecting raw materials sourcing costs [S16]. Cost inflation remains an overarching concern—commodities pricing spikes in petrochemicals or energy increase COGS materially necessitating persistent productivity drives. Execution risks attached to the restructuring plan carry potential for disruption both operationally and culturally if workforce reductions are perceived negatively impacting morale or capabilities [S28].
The rise of private label brands intensifies price competition requiring sharper brand positioning investments which may pressure margins long-term. Shifts in consumer shopping behaviors particularly towards channel fragmentation complicate inventory planning accuracy increasing markdown risk.
Currency exchange fluctuations introduce earnings volatility requiring hedging strategies that may not fully insulate financials in volatile environments. Regulatory compliance around environmental standards increasingly burdens product development pipelines potentially slowing new launches.
What To Watch Next
Key near-term markers include monitoring quarterly organic volume growth trends signaling consumer demand resilience amid macroeconomic pressures. Gross margin evolution will reveal how effectively pricing actions counterbalance input cost inflation alongside realized benefits from ongoing restructuring productivity gains. Updates on progress toward planned workforce reductions provide insights into execution discipline adapting the company’s cost structure for future competitiveness.
Innovation cadence matters: announcements of new product launches reflecting sustainability attributes or technology enhancements will indicate renewal of the innovation pipeline pivotal for differentiated growth.
Channel strategy developments especially regarding e-commerce expansion metrics will be critical given shifting retail landscapes post-pandemic acceleration. Lastly, any commentary addressing geopolitical tensions' impact on supply chains or raw material access will be vital given industry-wide exposure.
Financial Profile Discussion
As of June 30, 2026, P&G’s balance sheet shows current assets totaling approximately $26.2 billion against current liabilities of about $38.7 billion producing a current ratio near 0.68—a sub-1 ratio indicating working capital constraints that require active liquidity management [F1]. This position likely reflects seasonal timing differences in payables versus receivables alongside inventory positions tied to global logistics complexities.
Net income of $16 billion underpins strong cash flow generation though the company must carefully balance capital allocation priorities including reinvestment into innovation programs plus dividends/distributions expected by shareholders given P&G's history as a dividend aristocrat [F1][N6]. Debt levels have not markedly changed recently but require vigilant refinancing due over time across multiple tranches noted in recent bond maturities filings ensuring favorable borrowing costs remain accessible [S3][S17].
Overall free cash flow generation capability supports ongoing restructuring funding needs paired with capital expenditure commitments geared towards supply chain modernization confirming reasonably robust financial flexibility ahead.
This analysis synthesizes publicly disclosed regulatory filings up to August 2026 combined with recent earnings commentary providing an informed perspective on Procter & Gamble's operational posture within the dynamic household goods industry environment. It does not constitute investment advice but aims to frame business fundamentals contextualized by sector-specific drivers and peer considerations.
Disclaimer: This is research-only, informational analysis and not investment advice. It may include AI-generated interpretation and general industry context. Always verify important details using primary sources.

Comments