
Packaging Corp of America Boosts Scale Amid Industry Declines with Strategic Greif Acquisition
The acquisition of Greif's containerboard business in 2025 significantly expanded PCA's capacity, offsetting volume pressures in a challenging industry environment.
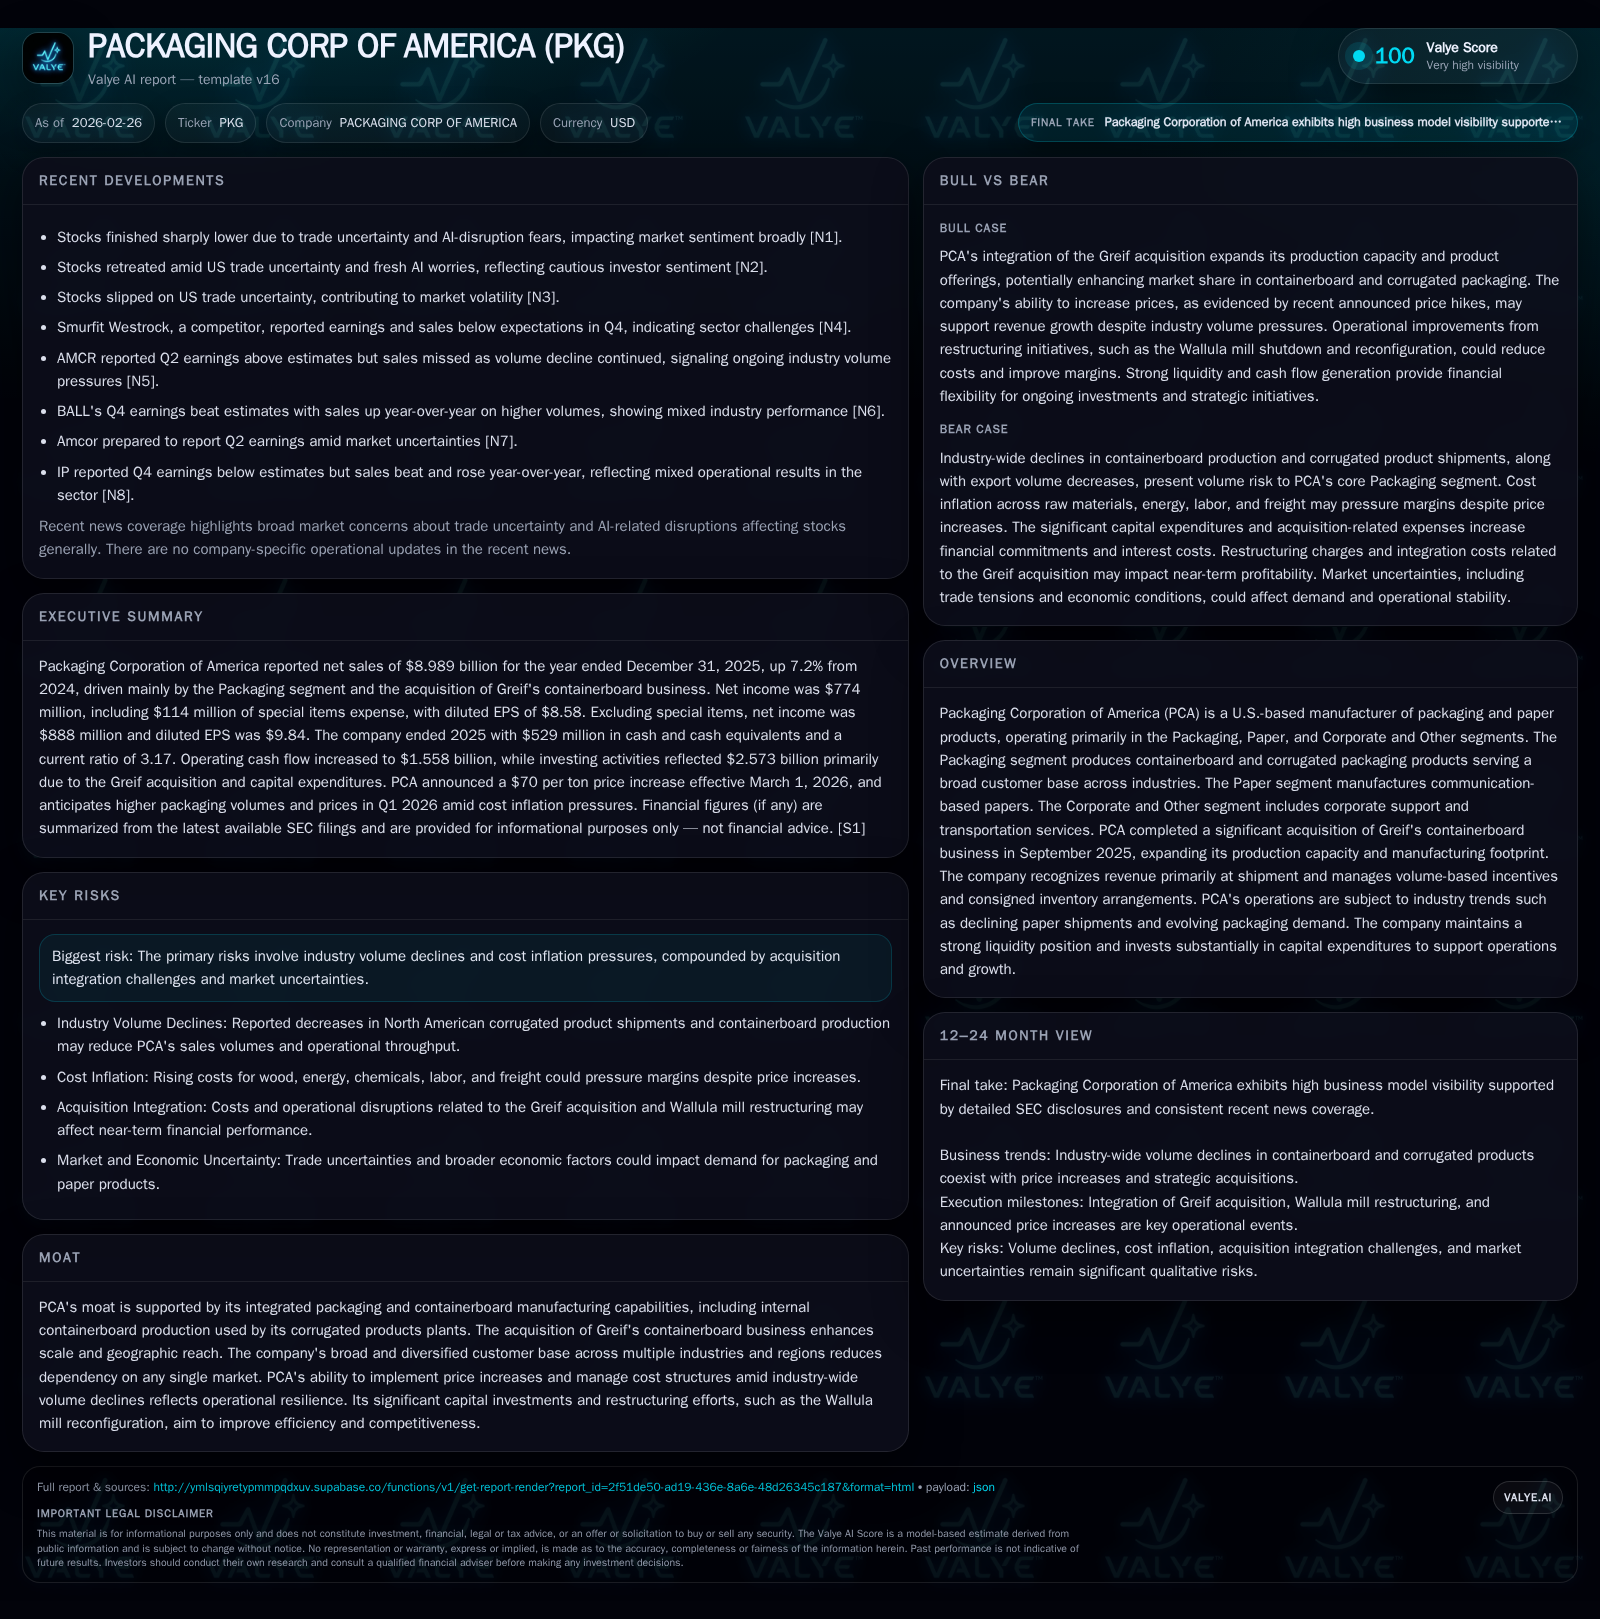
Packaging Corporation of America (PCA) delivered robust revenue growth in 2025, driven chiefly by its strategic $1.8 billion acquisition of Greif’s containerboard assets. This expansion bolstered the Packaging segment’s scale despite ongoing declines in paper volumes and containerboard industry shipments. While operating income edged up slightly, net income declined modestly due to acquisition-related expenses and special charges tied to mill reconfigurations. PCA maintained strong liquidity and capital discipline with solid cash flows supporting dividends and share repurchases even as integration costs and inflationary pressures persisted. Looking forward, PCA faces challenges managing inflationary input costs and demand volatility alongside price increases in linerboard and corrugated products.
Revenue Growth Fueled by Strategic Acquisition
Packaging Corporation of America’s total revenue reached $8.99 billion in 2025, marking a 14.1% increase year-over-year primarily attributable to the September 2025 acquisition of Greif's containerboard business for $1.8 billion [F1][S1]. This transaction added two containerboard mills and eight corrugated plants across the U.S., significantly expanding PCA’s packaging production capabilities.
Operating income edged up slightly by about 0.5%, reaching $1.11 billion as acquisition-related depreciation ($44 million) and interest expenses ($28 million) partly offset improved pricing and mix benefits across Packaging and Paper segments [F1][S1]. Net income declined by approximately 3.9% to $774 million due mainly to $114 million of special items including impairment charges related to restructuring at the Wallula mill [F1][S1]. Excluding special items, adjusted net income showed underlying operational strength.
Historical performance (annual)
| FY | Net ($mm) | CFO ($mm) | OpInc ($mm) | Capex ($mm) | Net YoY |
|---|---|---|---|---|---|
| 2025 | 774 | 1558 | 1107 | 829 | -3.9% |
| 2024 | 805 | 1191 | 1101 | 670 | +5.2% |
| 2023 | 765 | 1315 | 1075 | 470 | -25.7% |
| 2022 | 1030 | 1495 | 1421 | 824 |
Source: SEC companyfacts cache [F1].
Capital returns and efficiency (annual)
| FY | Div ($mm) | Buybacks ($mm) | FCF ($mm) |
|---|---|---|---|
| 2025 | 450 | 153 | 729 |
| 2024 | 449 | 0 | 522 |
| 2023 | 449 | 42 | 845 |
| 2022 | 420 | 523 | 671 |
Source: SEC companyfacts cache [F1].
Note: Earlier years' revenue not fully detailed; figures sourced from SEC filings and company disclosures.
Segment Performance: Packaging Expansion Versus Paper Challenges
The Packaging segment's growth was driven by the integration of Greif's assets which expanded containerboard capacity by about 800,000 tons annually along with increased corrugated product manufacturing capabilities [S7][S18]. Internal containerboard production supports higher-value packaging products and reduces reliance on external purchases.
Conversely, the Paper segment faced continued volume declines due to competition from electronic communication alternatives, with North American uncoated freesheet shipments falling nearly 10% year-over-year [S1]. Price increases partially mitigated volume losses through improved unit pricing implemented during the year.
This reflects PCA’s strategic focus on packaging innovation and scale advantages in segments less exposed to structural headwinds affecting traditional paper products.
Pricing Actions Amid Market Pressures
North American containerboard shipments declined roughly (1.8%) in calendar year 2025 amid elevated inventories estimated at approximately 2.8 million tons; export shipments fell sharply by (11.4%) [S1]. To address rising input costs including fiber and energy prices alongside freight inflation, PCA announced a significant price increase of $70 per ton for linerboard and medium effective March 1, 2026 [S3].
This move builds on earlier price index hikes (+$40/ton in February), reflecting proactive management of cost pressures through pricing power supported by product mix enhancements favoring premium corrugated displays.
Integration Costs and Operational Adjustments
Acquisition-related costs included accelerated depreciation charges ($44 million annually) and incremental interest expenses ($28 million) from new debt incurred for financing the Greif purchase [S4][S6][S10]. Operational disruptions such as scheduled maintenance outages occurred at acquired mills notably Wallula, where restructuring led to asset impairments totaling approximately $205 million pre-tax recognized mostly in Q4 2025 [S18].
These short-term impacts weighed on margins but are expected to yield longer-term efficiency gains through expanded manufacturing scale and optimized supply chains.
Capital Allocation: Dividends, Buybacks, and Investments
PCA sustained disciplined capital returns with dividends paid totaling $449.6 million in fiscal year 2025 while resuming share repurchases deploying $153 million to retire approximately 0.8 million shares under an authorized buyback program with about $283 million remaining capacity as of year-end [F1][S10].
Capital expenditures increased sharply by nearly one-quarter to $828.9 million supporting capacity expansions including the Wallula mill reconfiguration alongside other growth projects enhancing operational competitiveness [F1][S15].
Return on equity remained solid at approximately 16.8%, reflecting efficient use of equity capital post-acquisition [F1].
Financial Position: Liquidity and Debt Structure
At December 31, 2025, PCA held cash plus marketable securities near $529 million backed by current assets exceeding current liabilities yielding a strong current ratio around 3.17 [F1][S4][S13].
Long-term debt increased reflecting acquisition financing comprising several senior note issuances with coupon rates ranging from ~3% to ~5.7%, maturing between late-2027 and October 2051 [S4][S21]. The company maintains financial covenants restricting excessive leverage while preserving credit flexibility including unused revolving credit capacity near $573 million.
Outlook: Managing Inflationary Pressures and Demand Volatility
Management expects continued inflationary headwinds on fiber prices, wood procurement challenges due to winter conditions impacting yields, rising chemical costs, wage inflation from annual adjustments, and freight cost escalations amid trucking shortages [S3][S7].
Demand is forecasted to improve gradually but remains seasonally softer entering Q1 2026 with planned maintenance outages limiting production days; however, pricing actions effective March are anticipated to help offset margin pressure [S3]. Export prices are expected stable or slightly lower.
Ongoing focus lies on executing integration efficiently while navigating cyclicality inherent in packaging markets along with external risks including trade policy uncertainties that may affect export volumes adversely.
Investor Considerations: Key Risks and Milestones Ahead
Investors should monitor progress integrating acquired operations especially any sustained operational disruptions or further asset impairments such as those at Wallula mill [N6][S18]. Macro risks include potential economic slowdowns dampening industrial production or retail demand which could exacerbate shipment declines noted across containerboard markets.
Trade policy developments remain critical given last year's export shipment decline exceeding (11%), potentially influencing competitive dynamics beyond domestic sales channels [N14][S1]. Pricing execution aligned with index surveys will be imperative for margin stabilization amid cost pressures.
Upcoming earnings disclosures will provide transparency on margin trends post-integration costs while highlighting effects from freight inflation pass-throughs.
This analysis is based solely on data drawn from PCA’s SEC filings dated February 26, 2026 ([S#]), corroborated with contemporaneous news sources ([N#]) and validated financial metrics ([F1]). No extrapolations beyond disclosed information have been made.
Disclaimer: This is research-only, informational analysis and not investment advice. It may include AI-generated interpretation and general industry context. Always verify important details using primary sources.
Comments