
Dave & Buster's Navigates Market Pressures with Store Expansion and Operational Adjustments
Latest quarter reveals sales challenges offset by strategic new openings and enhanced food-beverage mix.
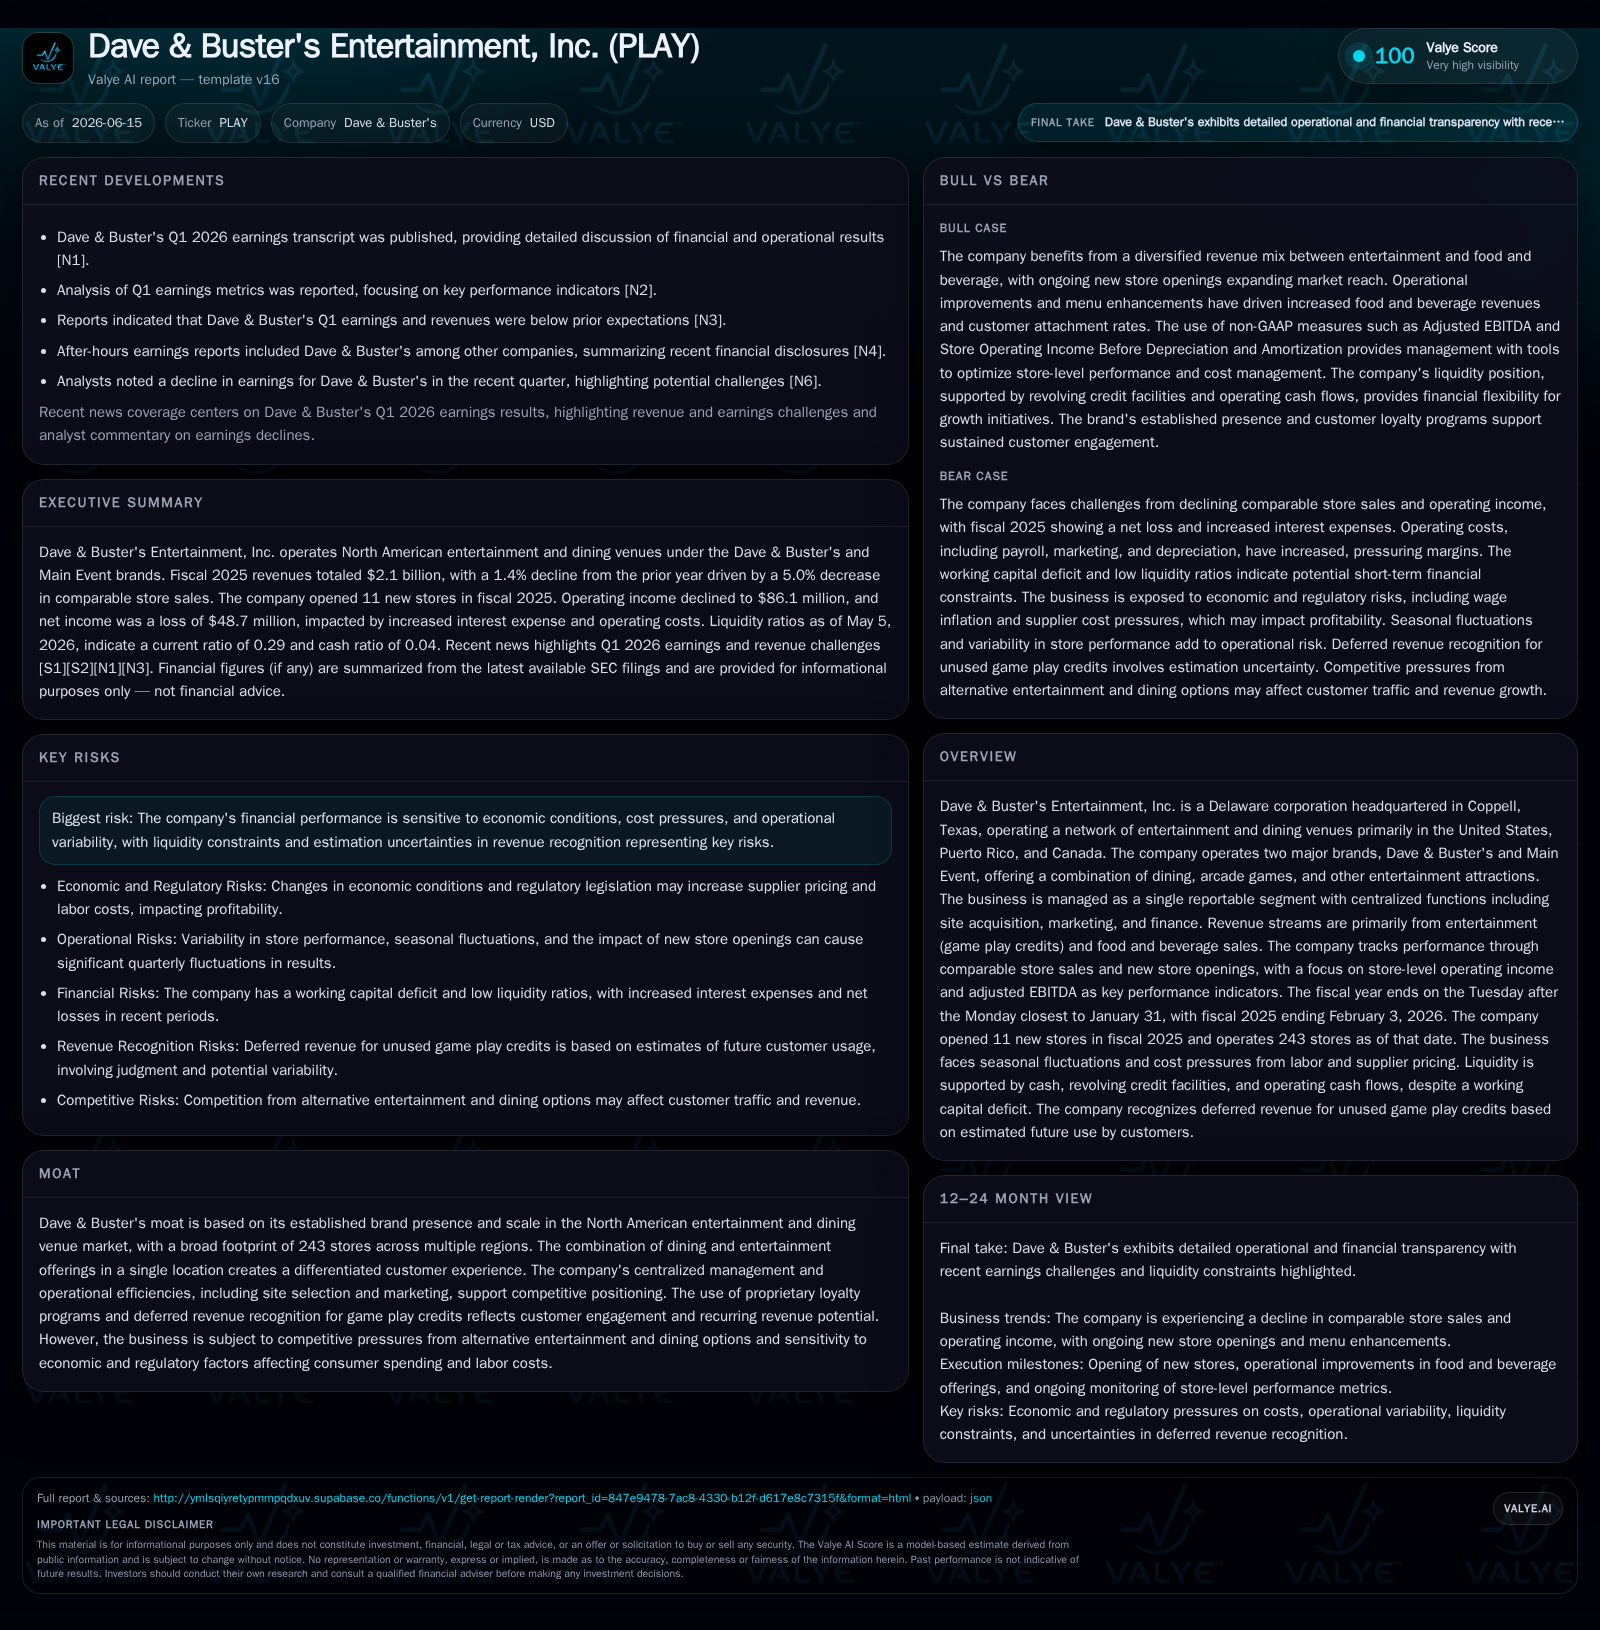
Dave & Buster's Entertainment, Inc. reported a slight decline in comparable store sales in Q1 2026, reflective of reduced walk-in customer traffic amid broader economic headwinds. Despite this, the company continues to expand its footprint with new store openings, bolstering overall revenues. The revenue mix shifted moderately towards food and beverage, supported by menu improvements and promotional strategies. Elevated operating costs, including labor and marketing, contributed to margin compression while capital investments focused on new stores and game enhancements. The company's competitive strength rests on its dual dining and entertainment offerings, loyal customer base, and scale, though it faces risks from economic sensitivity and cost inflation.
Recent Operating Update: Q1 2026 Performance
Conversely, Dave & Buster's leverages ongoing expansion initiatives with eight new Dave & Buster’s locations and three Main Event venues opened in fiscal 2025, further extending their geographic reach across North America [S1]. These openings buffered total revenues despite softness at established stores. Notably, operational focus on cross-selling food and beverage boosted those revenues both as absolute dollars and as a percentage of total sales — food and beverage ascended to over 37% of total revenue from roughly 35% previously, aided by menu enhancements and elevated promotion effectiveness such as the Eat and Play combo [S19].
Operating expenses saw an uptick in payroll costs reflecting wage inflation especially at noncomparable (newer) stores plus increased marketing spend aimed at stimulating foot traffic [S20]. Additionally, depreciation rose from investments in new venues and equipment refreshes indicating sustained capital intensity.
Business Model Nuances
Dave & Buster's revenue model centers on onsite consumer spending split between paid entertainment — principally arcade game play credits — and food/beverage sales. Customers purchase game credits prepaid or onsite; some portion of this is recognized as deferred revenue until redemption occurs. This not only smooths revenue recognition but also evidences recurring engagement through loyalty program incentives that encourage repeat visits [S1]. The combination of interactive amusements with casual dining creates a differentiated experiential offering designed to extend customer dwell time per visit, thus raising average spend per party.
Operationally, the company manages site acquisition strategically to select locations favorable for both visibility and demographic fit. Economies of scale arise via centralized marketing, purchasing leverage for supplies including games equipment and food inventories, as well as consistent technology platforms such as their recently implemented ERP system enhancing financial reporting continuity [S17].
Margins are influenced by the interplay of entertainment cost of sales—principally vendor fees for game maintenance and prize redemptions—and food/beverage costs which can fluctuate with commodity price volatility [S24]. Labor represents a significant fixed cost component given required staffing levels to operate large-scale venues safely while maintaining customer service standards. Occupancy costs including lease arrangements contribute another sizable expense line
Industry Structure and Competitive Positioning
Operating primarily within the Leisure and Entertainment Venues sector, Dave & Buster’s competes against various peers spanning family entertainment centers like Chuck E. Cheese’s; alternative amusement operators such as bowling alleys or trampoline parks; casual dining restaurant chains; cinemas; and event-hosting spaces. This breadth necessitates multi-dimensional competitive advantages.
The company's moat revolves around its extensive store network of 243 points across the U.S., Puerto Rico, and Canada combined with recognized brand equity fostering customer loyalty. Its dual emphasis on entertainment together with fully licensed dining attracts diverse demographic profiles—from families seeking day outings to adults targeting social nightlife experiences.
Operational efficiency gains through centralized functions support scalability beyond most midsized competitors who may lack the same national footprint or integrated technology stack. Proprietary loyalty programs underscore differentiated customer retention capabilities.
Nonetheless, persistent competition from lower-cost alternatives (e.g., traditional casual dining or streaming services), alongside evolving consumer leisure preferences exacerbated by economic headwinds, places pressure on sustaining growth rates organically.
Growth Drivers
Several factors underpin potential medium-term growth:
- New Store Openings: Expanding presence in targeted markets helps capture incremental consumption occasions while strengthening brand awareness [S1].
- Comparable Store Sales Enhancement: Tactical marketing campaigns with data analytics-driven personalization aim to improve frequency and average spend among existing customers.
- Menu Innovations & Food-Beverage Attachments: Enhancing culinary offerings supports higher spend per visit which benefits overall unit economics.
- Game Attraction Investments: Refreshing or introducing novel amusement options incentivizes renewed visits increasing game play credit utilization rates.
- Loyalty Program Expansion: Digital integration facilitates recurring engagement generating deferred revenue streams valuable for cash flow stability.
- Event Hosting Partnerships: Leveraging venues for group events or corporate functions drives ancillary volumes beyond walk-ins.
Management cited operational improvements via their ERP system rollout enabling better inventory controls, labor scheduling efficiencies, and streamlined finance workflows potentially enhancing margin profiles over time [S17]
Risks and Growth Constraints
Key concerns include:
- Economic Sensitivity: Discretionary consumer spend fluctuates with macroeconomic conditions impacting visitation frequency especially during downturns [S1].
- Cost Inflation Pressure: Rising wages due to minimum wage laws or labor market tightness increase overall operating expenses potentially outpacing pricing power [S24].
- Competitive Substitution: Growth of home-based entertainment or alternative leisure options could erode market share.
- Capital Intensity: Store openings require significant upfront investment (~$193 million spent on new stores during fiscal 2025) plus ongoing refurbishments necessitating continued capital expenditure allocation restraining free cash flow temporarily [S5].
- Seasonality & Weather Variance: Revenue streams remain vulnerable to seasonality effects particularly lower foot traffic during off-peak quarters or adverse weather periods.
- Regulatory Compliance: Health protocols, safety regulations related to gaming terminals or COVID-related changes may add operational complexity.
What to Watch Next
Key near-term metrics for monitoring include:
- Trends in comparable store sales sequentially post-Q1 given recent weakness measured prior period comparisons.
- Execution pace of planned new store openings along with initial performance benchmarks assessing site selection efficacy.
- Operating margin trajectory influenced by labor productivity initiatives amid inflationary headwinds.
- Capital expenditure distribution shifts distinguishing between growth capex versus maintenance/remodeling projects.
- Loyalty program enrollment trends signaling potential uplift in deferred revenue and repeat visits.
- Impact of initiatives intended to enhance cross-selling between gaming activities and food/beverage spend.
Management commentary during earnings calls will elucidate demand visibility against economic backdrops plus strategic adaptations addressing competitive dynamics [N1][N2][N3].
Financial Profile Brief Context
As of 2026-05-05, companyfacts shows $19.6 million in cash and equivalents against current liabilities exceeding $451 million yielding a low current ratio (~0.29), indicative of working capital deficits typical in retail-entertainment firms relying on rapid cash turnover [F1]
In summary, Dave & Buster's operates within a nuanced landscape balancing pressure from external economic forces with growth fueled by new venue expansion strategies complemented by targeted operational improvements. Its integrated entertainment-dining model remains relevant but requires ongoing innovation amidst cost challenges for sustainable profitability enhancement going forward.
Disclaimer: This analysis is based solely on publicly available information as delineated by SEC filings dated through June 15, 2026 (), supported numerical data ([F1]), supplemented by recent news reports (). It does not constitute investment advice or research views but aims to provide an informed industry-level view grounded strictly in verifiable evidence without speculative assumptions.
Disclaimer: This is research-only, informational analysis and not investment advice. It may include AI-generated interpretation and general industry context. Always verify important details using primary sources.
Comments