
Premier Air Charter Expands Fleet and Markets While Facing Liquidity Challenges
Premier Air Charter advanced its fleet capabilities and market presence in 2026, yet contends with liquidity constraints that weigh on financial flexibility.
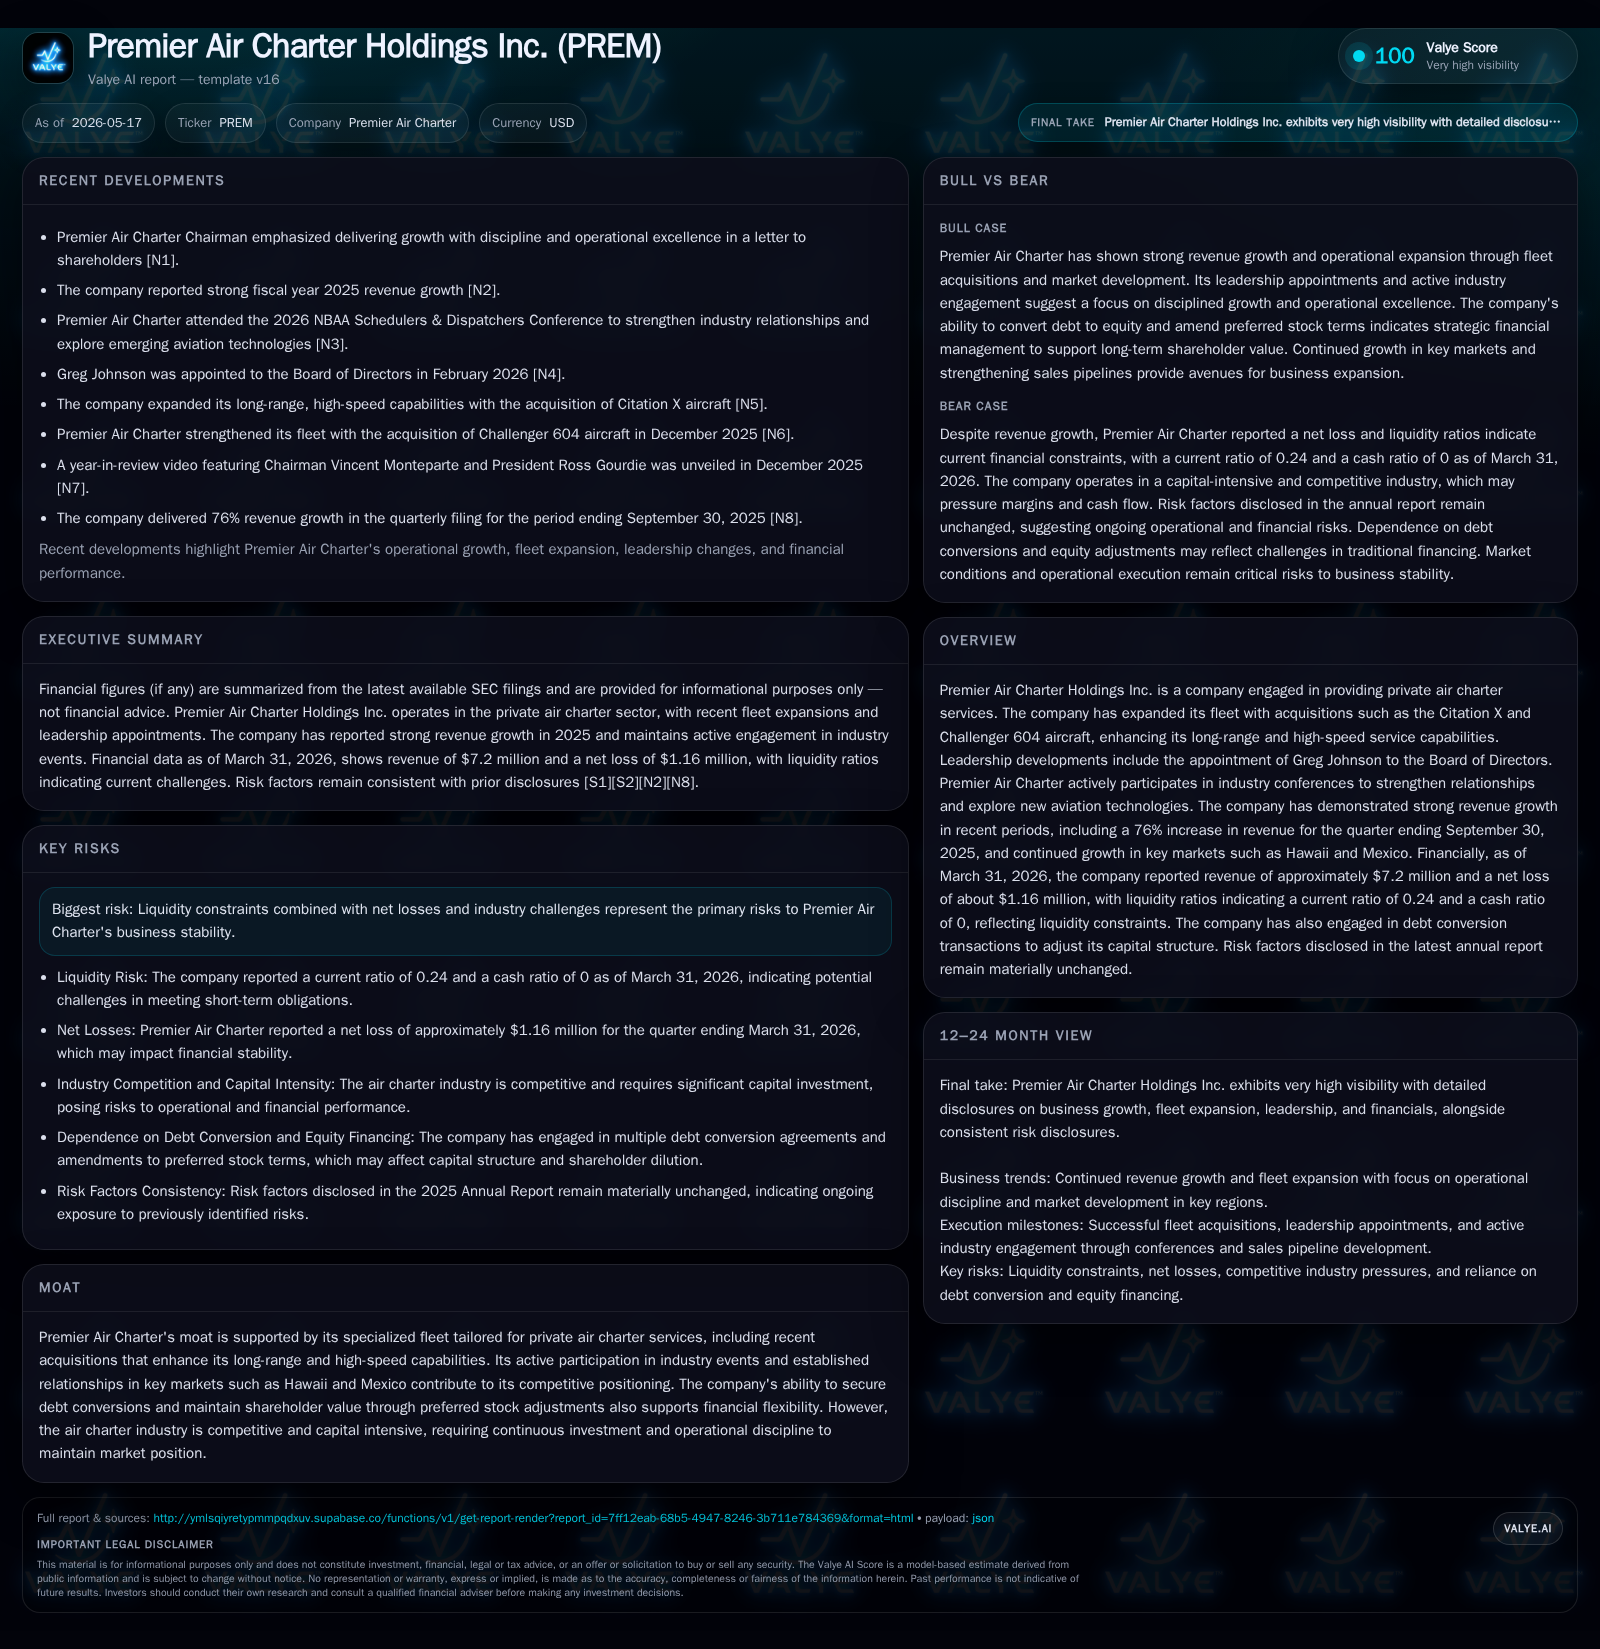
Premier Air Charter Holdings Inc.'s latest quarterly filing highlights strategic fleet expansions including Citation X and Challenger 604 jets, which have driven significant revenue growth into early 2026, particularly within Hawaii and Mexico markets. The company enhanced governance with a fintech-experienced independent director to support scalable technology-driven operations. However, Premier Air Charter faces pressing liquidity challenges reflected in a low current ratio and ongoing net losses, underscoring capital intensity risks inherent in private air charter. Market expansion and fleet modernization continue as growth levers but require careful navigation of competitive pricing pressures and cash flow constraints.
Latest Quarterly Operating Highlights: What Changed in Q1/Q2 2026
The most recent filing dated May 15, 2026 (10-Q) signals material developments capturing Premier Air Charter's operational trajectory moving into mid-2026 [S2]. Notably, the company has augmented its fleet with the acquisition of sophisticated aircraft models like the Citation X and Challenger 604. These platforms are known for their long-range capabilities and faster cruising speeds—attributes enabling Premier Air Charter to extend service offerings into more distant and premium routes such as international trips to Mexico and domestic luxury leisure travel to Hawaii [N1].
Simultaneously, board-level corporate governance saw enhancement with the appointment of Greg Johnson, an industry veteran commanding expertise at the intersection of aviation and fintech sectors. His background encompasses leadership roles in private aviation marketplaces and payment systems integration—capabilities likely poised to drive cost efficiencies and intelligent pricing frameworks [S26]
These operational upgrades underpin Premier's strategic positioning amid intensifying competition but also expose vulnerabilities discussed later relating to financial constraints.
Business Model Essentials: Revenue Streams and Service Differentiation
Premier Air Charter generates revenue primarily by offering private jet charters billed typically on an hourly flight basis or per-trip fare agreements tailored to client specifications [S1]. Customers comprise high-net-worth individuals, corporate executives, and leisure travelers prioritizing time-efficiency, privacy, and bespoke scheduling.
Service differentiation ties closely to the company's fleet composition; owning long-range jets like Citation X enables access to premium routes requiring extended non-stop flight capability at higher speeds versus regional jets or turboprops that competitors might feature. Such specialized assets justify premium pricing power anchored in convenience and performance metrics customers highly value.
Operationally, fixed costs involve maintenance-intensive management of diverse aircraft types while variable costs revolve around fuel consumption per flight hour and crew deployment. Utilization rates hence critically drive unit economics: higher aircraft flight hours dilute fixed overheads producing stronger margins if load factors remain steady [S2]
Switching costs tend to be moderate; while clients may sample multiple providers based on availability or price promotions, established relationships reinforced through repeat bookings foster some loyalty.
Fleet Composition and Its Role in Competitive Positioning
Premier’s recently expanded fleet now includes notable long-range platforms: the Citation X offers one of the fastest flying speeds among business jets coupled with transcontinental range capabilities. Meanwhile, the Challenger 604 complements this by offering proven reliability for both domestic coast-to-coast routes as well as international short-haul trips into Central America [S1][S2].
This mix allows Premier Air Charter to cover route corridors extending beyond typical regional boundaries historically served by smaller fleets focused predominantly on short hops. Consequently, this confers a competitive advantage particularly in serving lucrative leisure markets like Hawaii from mainland U.S., which demand efficient direct travel options not always available through commercial airlines.
Capital investments required for these acquisitions highlight inherent tradeoffs: while enhancing service breadth potentially commands better yield capture due to rarity value, it also escalates capital intensity through higher depreciation charges plus insurance liabilities.
The ability to flexibly schedule these jets across varying client needs embodies an operational complexity that demands sophisticated route planning systems—potentially benefiting from technology investments highlighted by board expertise [S26].
Industry Context: Competitive Environment, Pricing Dynamics, and Customer Trends
Within the private air charter sector, barriers include substantial upfront capital requirements for aircraft procurement alongside regulatory compliance burdens around pilot certification and safety standards. The industry's fragmentation means competition primarily occurs among boutique operators differentiated by fleet size/specialization or geographic footprint.
Pricing power benefits accrue notably when operators control unique or scarce assets like super-mid jets capable of transoceanic flights or high-speed transits that traditional competitors cannot easily replicate. Premium clientele increasingly seeks flexible luxury travel aligning with evolving work-from-anywhere lifestyles post-pandemic normalization.
Demand drivers remain structurally favorable given rising global wealth concentration facilitating discretionary spending growth on exclusive travel experiences. However, the cyclical nature remains evident as economic downturns or elevated fuel prices can compress margins rapidly.
Peers in this space often compete on both service reliability dimensions (on-time departures) and customer experience personalization—a sector where reputation effects can produce meaningful switching friction despite no formal loyalty programs.
Growth Drivers: Fleet Expansion, Market Penetration, and Technological Engagement
Premier's recent fleet expansions represent a direct lever for top-line acceleration; new Citation X additions enable opening longer-haul route offerings previously inaccessible or less economically viable. Market penetration appears focused on geographically lucrative corridors such as Hawaii-Mainland U.S. leisure sectors and Mexican outbound business/leisure flights leveraging these jets' range [N1][S2].
Technologically, engaging an aviation fintech executive at board level signals intent to integrate advanced pricing algorithms, payment automation platforms, or even marketplace infrastructure aimed at improving booking efficiency and lowering distribution costs [S26][N2]. These initiatives could enhance yield optimization capabilities amid competitive pressures.
Operational excellence themes stressed in recent shareholder communications emphasize disciplined capacity management critical in matching fixed-cost-heavy asset bases with volatile demand patterns [N2]. As such, increased utilization combined with selective route optimization will determine margin scalability going forward.
Key Risks: Liquidity Constraints, Capital Intensity, and Industry Competition
Despite encouraging revenue growth trajectories, Premier Air Charter confronts acute liquidity stress underscored by a current ratio approximating 0.24 at quarter end March 31, 2026—indicating significant short-term liabilities relative to liquid assets [F1]. This tight liquidity position imposes constraints on operational flexibility such as timely maintenance spending or marketing investments necessary to sustain growth momentum [S2].
Net losses stacking near $1.16 million during recent periods demonstrate persistent profitability challenges potentially exacerbated by high depreciation/amortization expenses tied to recent jet acquisitions plus costs associated with scaling operations [F1][S3]. Capital expenditure requirements are material given aviation asset replacement cycles plus certification/upkeep compliance mandates.
Competitive pressure also remains pronounced as numerous private charter service providers vie for a relatively niche customer base where price sensitivity can emerge once pandemic-era pent-up demand normalizes [S7][S18]. Any slowdown in premium travel segments or spikes in input costs (fuel/yield management) could further strain financial performance.
Monitoring debt maturities or preferred stock conversion dynamics remains important given earlier Series A Preferred Stock adjustments reflecting financial restructuring efforts undertaken mid-2025 through late-2025 [S9][S11][S23]
What to Monitor Next: Upcoming Milestones and Financial Health Indicators
Key near-term indicators include quarterly margin improvement trends providing insight into whether operating leverage is realized amid ramped utilization on new fleet additions [S2]. Tracking exact rate per flight hour improvements would shed light on price/mix shifts supporting enhanced unit economics.
Further announcements related to any additional fleet purchases or sale-leaseback transactions would signal capital structure strategy influencing liquidity risk profile [S25][S23]. Similarly, follow-on disclosures about preferred equity share conversions or refinancing initiatives bear relevance for balance sheet stability
Operational KPIs such as utilization metrics by individual jet type could give advance warning regarding customer retention strength especially within targeted routes like Hawaii/Mexico niche segments identified as growth pockets [N1][N2]. Board commentary regarding technology implementation timelines also merits attention given anticipated impact on cost structure efficiencies.
Summary Financial Profile: Recent Results and Balance Sheet Overview
Revenue through March 31, 2026 approached $7.2 million reflecting strong double-digit growth compared with prior periods supported by top-line drivers highlighted above [F1][N1]. Nonetheless, net losses persisted at roughly $1.16 million during recent quarters illustrating ongoing challenges converting growth into profitability amid heavy capital charge burdens.
Balance sheet analysis reveals stringent liquidity conditions evidenced by a current ratio near 0.24 juxtaposed against current liabilities exceeding $18 million versus roughly $4.5 million in current assets as of quarter-end [F1]
Total debt reported was modest ($25,000 estimate) although the preferred stock issuance history suggests off-balance-sheet financing mechanisms warrant detailed scrutiny when examining overall leverage exposure reported elsewhere [F1][S9][S11]. This liquidity profile underscores that despite revenue expansion successes, maintaining operational sustainability necessitates continued capital discipline alongside effective cash flow governance going forward.
This analysis synthesizes public SEC filings and news disclosures up to May 17, 2026 without offering investment advice or forecasts.
Disclaimer: This is research-only, informational analysis and not investment advice. It may include AI-generated interpretation and general industry context. Always verify important details using primary sources.

Comments