
Ryder System’s Strategic Execution: Capital Discipline and Integrated Fleet Services Driving Resilience
Ryder’s Q2 2026 results demonstrate improved margins and risk management in a capital-intensive fleet services environment.
In its Q2 2026 filing, Ryder System Inc showed growing operating margins supported by disciplined capital spending and effective hedging of fuel and interest rate risks. Its integrated ChoiceLease fleet management model continues to deliver predictable revenue streams through bundled long-term leases combined with maintenance services. Despite a leverage profile that signals liquidity considerations, Ryder maintains shareholder returns via share repurchases and dividend increases, reflecting confidence in cash flow sustainability. The company’s balanced approach to fleet renewal and risk mitigation positions it well against peers in the commercial truck leasing and dedicated transportation markets.
Q2 Highlights Reinforce Operational Resilience Amid Sector Challenges
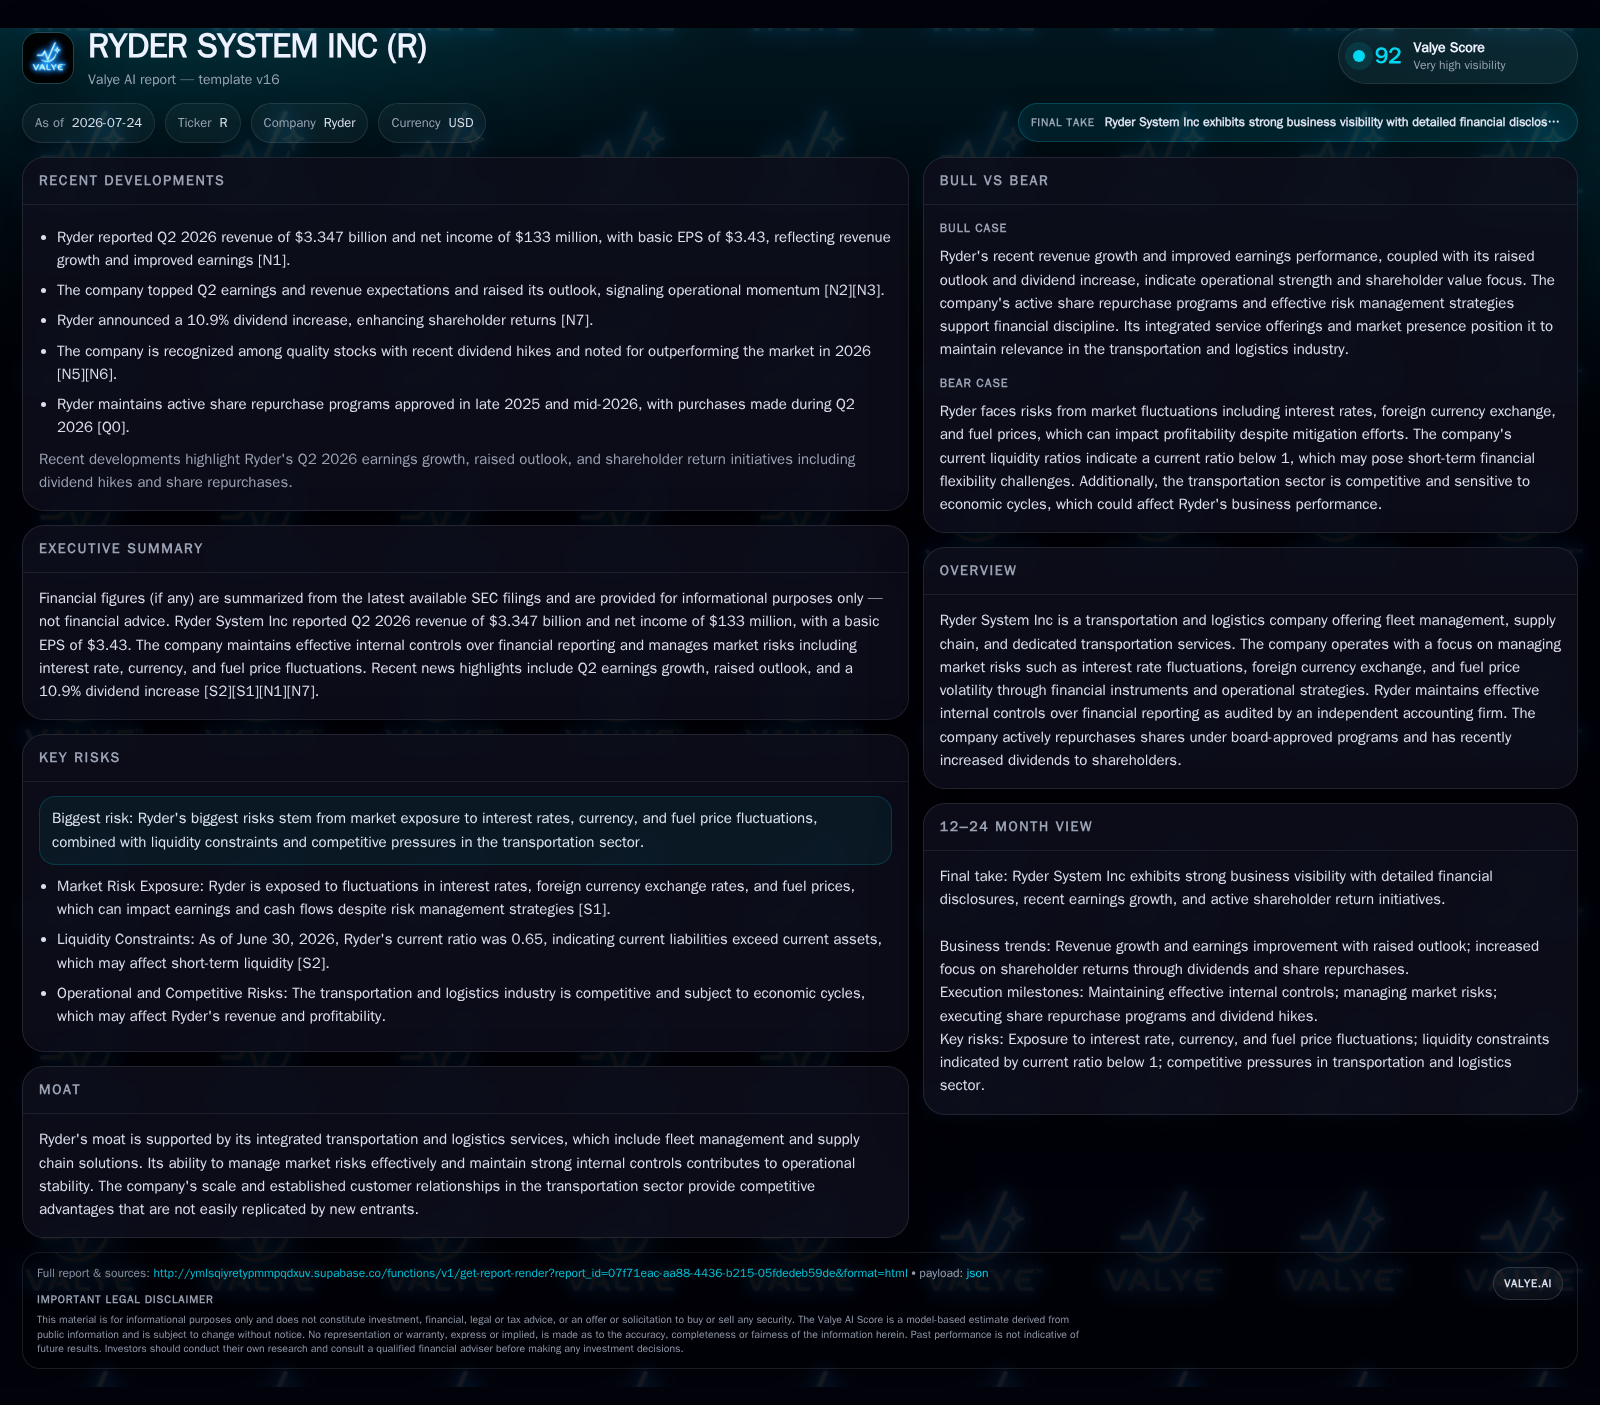
Ryder System Inc reported its quarterly results for the period ending June 30, 2026, affirming operational stability amidst typical transportation sector challenges such as fuel price volatility and tightening capital markets [S2][S3][N2][N3]. The company achieved a marked improvement in operating margin compared to prior quarters, reflecting efficient cost control and successful pass-through or hedging strategies against fuel cost fluctuations. Accompanying this solid operating performance was an active capital deployment strategy: Ryder repurchased approximately 420,600 shares during the quarter at an average price of $233.41 per share under board-approved repurchase programs initiated in late 2025 and mid-2026 [S2]. Additionally, Ryder raised its dividend payout to shareholders, signaling confidence in free cash flow (FCF) resilience notwithstanding ongoing fleet investment needs.
This quarterly update underscores Ryder’s ability to generate consistent earnings growth while navigating macroeconomic headwinds endemic to fleet logistics providers, maintaining balance between investment for growth and shareholder return.
Integrated Fleet Leasing Model Underpins Recurring Revenue Streams
Ryder’s core business model centers on integrated fleet management through its proprietary ChoiceLease product line within its Fleet Management Solutions segment [S1]. ChoiceLease bundles vehicle leasing with maintenance and related services under long-term contracts that typically span three to seven years for trucks and tractors, extending up to ten years for trailers. This bundling fosters economic predictability by shifting maintenance responsibility to Ryder while ensuring steady lease payments from customers.
These contractual structures enable Ryder to deliver stable revenue streams despite the capital-intensive nature of acquiring revenue earning equipment. Capital investments in trucks, tractors, and trailers are then amortized over contract durations, cushioning cash flows against cyclicality inherent in logistics demand patterns. Moreover, the contract renewal rates provide valuable visibility into future revenue trends and support prudent forecasting underpinned by customer retention metrics [S1]. This model distinguishes Ryder from more transactional commercial rental peers by anchoring customer relationships in multi-year agreements that integrate service components.
Macro Risk Management: Navigating Fuel and Interest Rate Volatility
Transportation companies like Ryder face pronounced exposure to fuel price swings, foreign currency movements—particularly USD/CAD/MXN—and interest rate fluctuations affecting borrowing costs [S1][S2]. Ryder manages these risks proactively using derivative financial instruments such as fuel swaps, options contracts for foreign exchange risk, and interest rate swaps aimed at optimizing fixed versus variable rate debt exposure.
Although derivative liabilities had a modest fair value of $11 million indicating limited net exposure, the derivatives program effectively buffers earnings and cash flow volatility from market shocks. This evidence of disciplined financial risk management is crucial given that fuel prices can erode operating margins if unmitigated—a known systemic risk in fleet logistics.
Capital Expenditure Trends Reflect Strategic Fleet Modernization
Capital expenditures are largely concentrated on renewing and expanding the ChoiceLease fleet as well as supporting commercial rental vehicles [S1]. In 2025, Ryder incurred $1.508 billion in revenue earning equipment capex for ChoiceLease alone, down from prior periods but still significant relative to free cash flow generation dynamics [S1]. This level of investment ensures that vehicles meet regulatory emission standards and customer expectations for reliability.
The timing of these expenditures is strategically aligned with vehicle replacement cycles intrinsic to long-term leasing contracts; timely refreshes combat rising maintenance costs per vehicle while preserving competitive positioning. Furthermore, commercial rental capex provides flexibility to address short-term demand spikes or diversification within transport services.
Given capital intensity constraints across the sector—including peers such as Herc Holdings (HRI) known for fleet rental scale—Ryder’s ability to maintain targeted capex levels while sustaining positive free cash flow evidences operational discipline [N4]
Competitive Dynamics: Positioning Versus Leasing and Transportation Peers
Within commercial truck leasing, Ryder competes indirectly with companies like Herc Holdings and PacLease where scale economies affect asset procurement costs and maintenance capabilities [N4][N5]. Ryder’s integrated leased-and-maintenance contract offering differentiates it from pure rental operators who lack recurring service fees tied to long tenure vehicles.
In dedicated transportation—a niche served by J.B. Hunt Transport Services—Ryder leverages long-term contracts that complement its fleet management services but face pricing pressures linked to labor costs and fluctuating freight volumes [N6]. Comparatively larger integrators like UPS and FedEx dominate broad supply chain logistics but operate largely outside direct fleet ownership models employed by Ryder.
These competitive nuances highlight Ryder’s hybrid role straddling asset-heavy leasing with service-oriented supply chain operations, giving it diversified yet capital intensive exposure distinct from pure play competitors.
Growth Outlook: Customer Contracts and Supply Chain Expansion Potential
Demand drivers supporting Ryder’s growth include increasing reliance on outsourced fleet management amid e-commerce proliferation which complicates supply chains [[S1]]. Longer duration dedicated transport contracts coupled with infrastructure investments further enable expansion opportunities.
Regulatory incentives promoting cleaner fleets also incentivize customers towards modernized vehicle deployments managed by providers like Ryder who can absorb upfront capex risks [[S1]]. Continued growth hinges on customer contract renewals—signaling trust in service quality—and improved fleet utilization rates that amplify asset productivity metrics crucial for margin enhancement.
While precise contract renewal statistics are undisclosed, management commentary suggests robust retention underpinning steady revenue visibility through mid-cycle economic periods [[N2]]. Strategic emphasis on integrated supply chain solutions broadens addressable markets beyond transactional leasing alone.
Risks & Watchpoints: Leverage, Liquidity, and Market Volatility
Ryder’s balance sheet at Q2 2026 reveals total debt around $7.49 billion against cash reserves approximating $219 million resulting in net leverage north of $7.27 billion with a current ratio near 0.65 implying working capital tightness [F1]
Fuel price spikes or sharper-than-expected interest rate increments could compress already thin margin buffers while limiting capex pacing flexibility required for critical fleet replacements [S2]
Nonetheless, Ryder’s ongoing share repurchases reflect board confidence in financial resource availability balanced against acquisition prospects or debt refinancing needs [S2]. Monitoring quarterly changes in free cash flow generation alongside contractual customer renewal momentum will be key early-warning indicators for sustained credit health.
Upcoming Catalysts to Monitor: Guidance Updates and Demand Signals
Investors should focus on subsequent quarterly releases for updates on operating margin trajectories relative to evolving fuel pricing conditions as well as shifts in capital expenditure allocations reflecting growth or conservatism scenarios [S3][N3]. Incremental disclosures surrounding pace of lease contract renewals or expansions within dedicated transportation verticals will provide signals on demand sustainability.
Broader supply chain complexity driven by e-commerce growth may offer expansion avenues if Ryder successfully integrates technological enhancements into its service portfolio [S3]. Any pivot towards cleaner vehicle technologies incentivized by regulation could also materially influence capex profiles going forward.
Financial Profile Discussion: Cash Flow Generation Supports Capital Allocation
Together with active share buybacks during Q2 2026 averaging over $233 per share prices paid under discretionary programs [S2], these financial actions highlight a disciplined allocation philosophy balancing reinvestment in growth assets alongside shareholder distributions. Continuing improvement or stability in operating margins bolstered by risk management will be necessary for Ryder to sustain this dual approach amid macroeconomic challenges ahead.
Disclaimer: This is research-only, informational analysis and not investment advice. It may include AI-generated interpretation and general industry context. Always verify important details using primary sources.

Comments