
RideNow Group Focuses on Inventory Optimization and Refinancing Amid Economic Pressures
Latest quarterly disclosures reveal RideNow’s operational shifts, refinancing milestones, and strategic emphasis on profitability within the fragmented U.S. powersports retail sector.
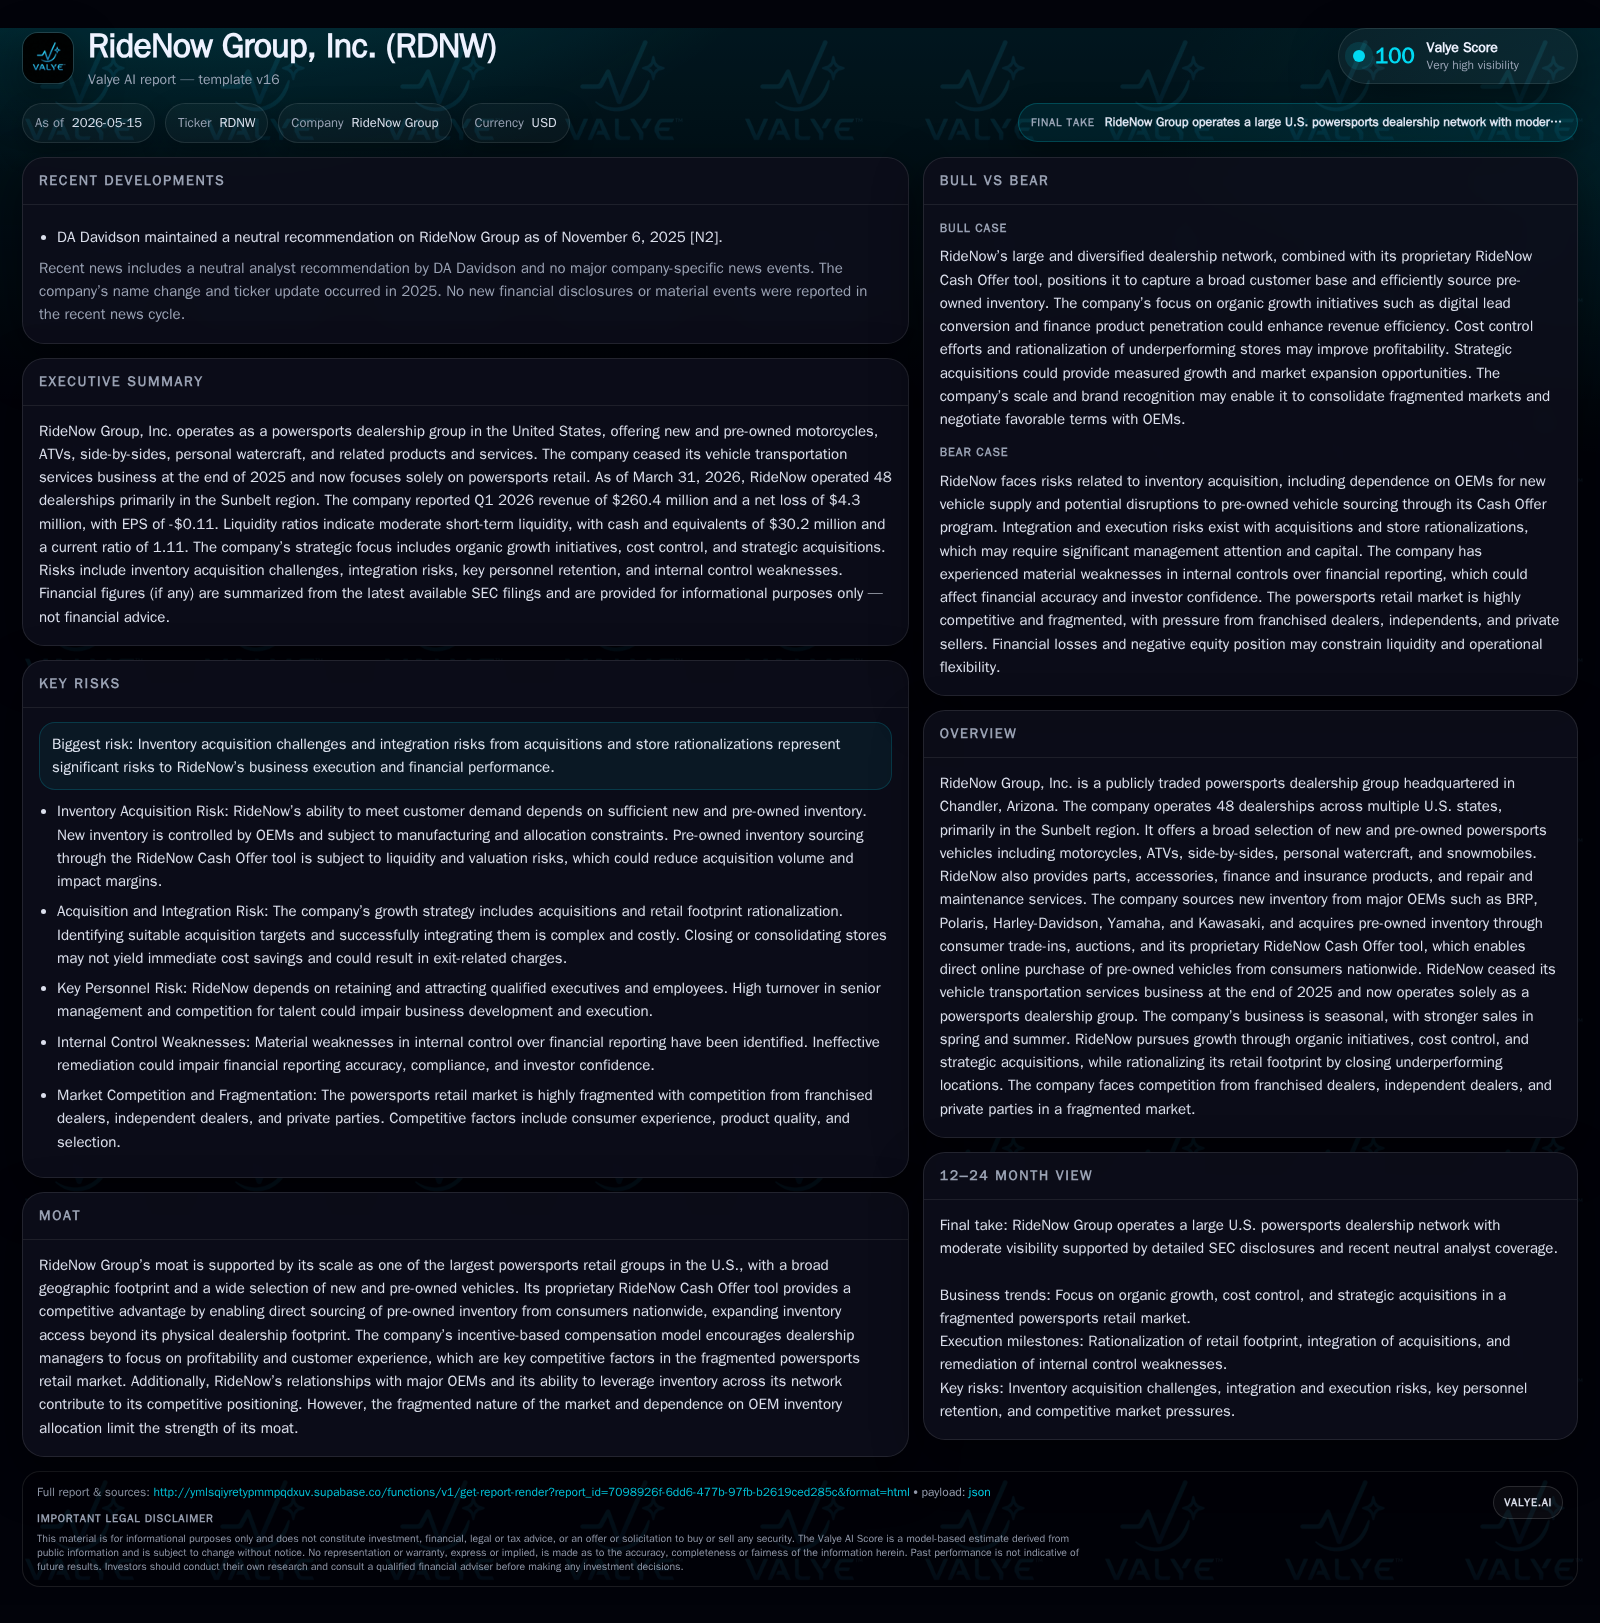
RideNow Group, Inc. reported early 2026 results marked by ongoing inventory optimization following dealership consolidations in 2025 and the cessation of its vehicle transportation segment. The company is navigating macroeconomic challenges including tariff impacts and elevated interest rates, which influence consumer financing and floorplan costs. With a network of 48 stores concentrated in the Sunbelt and proprietary tools like the RideNow Cash Offer, the firm leverages scale but faces competitive pressures from market fragmentation. Near-term growth hinges on inventory sourcing, same-store performance, and successful refinancing ahead of upcoming debt maturities.
Recent Operating Update
RideNow Group’s first quarter ended March 31, 2026 report confirmed its strategic exit from the vehicle transportation services business at the close of 2025, now concentrating solely on its core powersports dealership operations [S2]. This pivot follows the closure or sale of five underperforming stores during 2025 — an action that has led to the adoption of same-store operating metrics to accurately track business health without distortions from footprint changes [S13].
The company currently operates 48 dealerships primarily throughout the Sunbelt states such as Arizona, Texas, Florida, and Georgia [S1]. Its revenue streams are derived from sales of new and pre-owned powersports vehicles (including motorcycles, ATVs, side-by-sides, personal watercraft), as well as associated parts, service, accessories (PSA), finance & insurance products bundled with retail vehicles (F&I), and repair/maintenance services [S1][S13].
Q1 2026 saw RideNow navigating a complex macroeconomic environment characterized by heightened tariff uncertainties that could increase cost-of-sales and impact MSRP settings negatively affecting volumes. Concurrently, sustained high interest rates influence consumer borrowing costs — likely dampening demand for higher-priced vehicles — while increasing corporate floorplan interest expense due to variable rate exposures [S2]. Management continues aggressive inventory management initiatives to balance these forces.
Business Model
RideNow’s revenue model hinges on acquiring vehicles—both new from OEMs like BRP, Polaris, Harley-Davidson—and pre-owned through trade-ins, auctions, and increasingly via its proprietary RideNow Cash Offer tool. This digital platform enables nationwide direct sourcing of pre-owned units from consumers outside dealership footprints fostering enhanced inventory breadth [S1].
The company sells vehicles through both retail and wholesale channels—the former contributing higher margins due to direct consumer sales plus attached F&I and PSA revenue streams; wholesale sales serve as a mechanism to move excess or non-core inventory albeit at lower margin [S14]. Gross profit per unit varies significantly with vehicle type (new vs pre-owned), sales channel (retail vs wholesale), reconditioning costs on used units, and pricing adjustments responsive to demand/supply imbalances [S14][S13].
Run-the-best-dealerships strategy drives management incentives tied closely to profitability and customer experience rather than volume alone—a key differentiator given powersports retail’s traditionally fragmented landscape [S1]. The company leverages a broad multi-state network allowing it to shift stock internally to address local demand variations efficiently.
Industry Structure and Competitive Position
The U.S. powersports retail industry is fragmented with competition ranging from traditional franchised dealers to independent operators specializing in pre-owned or niche segments. Critical success factors include product selection breadth/depth, customer experience provision encompassing sales through after-sales care including service quality [S1].
RideNow’s moat lies partly in its scale—one of the largest U.S. multisite powersports dealership groups—and geographic diversity predominated by Sunbelt states offering favorable demographic tailwinds for outdoor recreational spending. Its proprietary technology enabling direct nationwide consumer sourcing expands inventory access beyond physical locations—an advantage against competitors limited to local trade zones.
Nevertheless, the market's fragmented nature limits strong moats industry-wide; additionally dependency on OEM new vehicle allocations introduces vulnerability given constrained supply chains especially during tariff regime shifts or trade tensions amplifying costs or limiting stock availability [S2].
Growth Drivers
Key growth vectors include:
- Inventory Sourcing Optimization: Enhanced use of the Cash Offer platform expands high-quality pre-owned acquisition beyond traditional trade-ins or auctions providing improved retail-ready vehicles and margin potential [S1][S13].
- Same Store Sales Enhancement: Post-store rationalization focus shifts towards improving productivity metrics within existing dealerships leveraging incentivized management models geared towards profitable operations rather than visible scale alone [S2][S13].
- Ancillary Revenue Expansion: Growth in F&I offerings such as extended service contracts alongside parts/service/accessory sales improves gross profit per transaction due to their higher margin profiles relative to vehicle sales alone [S13][S14].
- Geographic Market Penetration: Concentration in Sunbelt markets aligns well with favorable demographic trends supporting discretionary spending on recreational vehicles.
- Operational Controls Around Tariff & Financing Rate Exposure: Proactive tariff monitoring efforts with OEM partners alongside stringent floorplan interest cost management help sustain margin integrity amidst inflationary pressures [S2].
Risks / Watchpoints / Growth Constraints
- Refinancing Uncertainty: The company’s amended Credit Agreement requires mounting a refinancing process before September 30, 2026 with completion targeted by November 30. Failure triggers default risks despite compliance as of Q1 end [S11][S17]. This refinancing is critical given long-term debt principal balances near $220 million plus floorplan borrowings totaling approximately $263 million as of March 31 reflecting significant leverage exposure [F1][S11].
- Inventory Acquisition Challenges: Dependency on OEM allocations exposes RideNow to supply chain volatilities amplified by evolving tariff regimes potentially increasing entry prices or constraining supply leading to less favorable product mixes [S2].
- Macroeconomic Environment Impact: Elevated interest rates pressure consumer financing affordability which could lead customers toward lower priced units or defer purchases impacting unit volumes adversely; similarly general inflation or economic uncertainty could restrict discretionary spending patterns among younger demographics crucial for sustained industry growth [S2].
- Integration Risks: Previous acquisition-driven growth necessitates continued attention towards store integration effectiveness and consistency in execution across diverse operating sites—especially post rationalizations completed in prior periods posing ongoing operational risks [S13].
- Competitive Fragmentation: Limited pricing power relative to smaller competitors who might specialize locally affects ability to raise prices without volume loss; variable gross profit per unit requires careful channel mix management [S14].
What To Watch Next
Investors should focus on several key milestones and operating indicators:
- Progress made toward refinancing milestones ahead of required September–November deadlines as outlined in Credit Agreement Amendment No.10 including potential announcements regarding lenders engagement or new capital raising strategies [S11][S17].
- Same store revenue performance trends tracking effectiveness of store rationalization combined with refined management incentives aimed at boosting profitability rather than sheer volume growth [S13][S22].
- Inventory levels and mix evolution—particularly growth in retail-ready pre-owned sourced via RideNow Cash Offer platform—as these will signal success in increasing margin-rich vehicle sales capacity amid constrained OEM inventories [S13].
- Tariff developments impacting cost structures alongside any tangible impacts from fluctuating interest rates evidenced in consumer purchase patterns or financing product uptake serve as external demand barometers relevant for medium-term outlook [S2].
- Ancillary revenue growth percentages will indicate diversification success beyond cyclical vehicle transactions toward steadier high-margin service ecosystem capture.
Financial Profile Summary (Q1 2026 Context)
Latest financial snapshot
| Metric | Value | Period |
|---|---|---|
| Cash & equivalents | $30mm | |
| 2026-03-31 | ||
| Current assets | $385mm | |
| 2026-03-31 | ||
| Current liabilities | $346mm | |
| 2026-03-31 | ||
| Current ratio | 1.11x | |
| 2026-03-31 |
Source: SEC companyfacts cache [F1].
As of March 31, 2026, RideNow reported cash plus restricted cash totaling approximately $46.4 million while total current assets stand at $384.8 million against current liabilities of $346.2 million producing a current ratio of roughly 1.11 reflecting modest short-term liquidity coverage supported by working capital stability [F1][S18].
Total debt principal amount approximates $474.3 million inclusive of floor plan notes near $263 million complemented by long term loans around $211 million net after issuance cost amortization indicating elevated leverage typical within asset-heavy retail networks reliant upon financed inventory floors [F1][S11].
Cash flow generation showed deterioration from prior year quarters primarily driven by increased inventory buildup designed to capture incremental sales growth; however this ties up working capital intensifying refinancing importance given upcoming debt maturities; financing cash flows benefited from increased borrowings outside trade floor plan lines partially offsetting operating outflows signaling tactical liquidity management efforts underway [S22][S11].
Operating expenses notably grew modestly with compensation expense up slightly consistent with efforts to strengthen dealership teams including incentives oriented around operational improvements versus just scale pursuits; facility overheads declined mildly illustrating ongoing cost discipline refinement initiatives supporting margin maintenance amid cost pressures [S2].
Overall financial posture suggests continuity assurance over next twelve months given liquidity buffers but underscores refinancing execution risk needing resolution soon to secure longer-term capital structure sustainability.
This analysis synthesizes publicly filed SEC disclosures up through May 14, 2026 combined with company-provided operational frameworks without offering investment advice.
Disclaimer: This is research-only, informational analysis and not investment advice. It may include AI-generated interpretation and general industry context. Always verify important details using primary sources.

Comments