
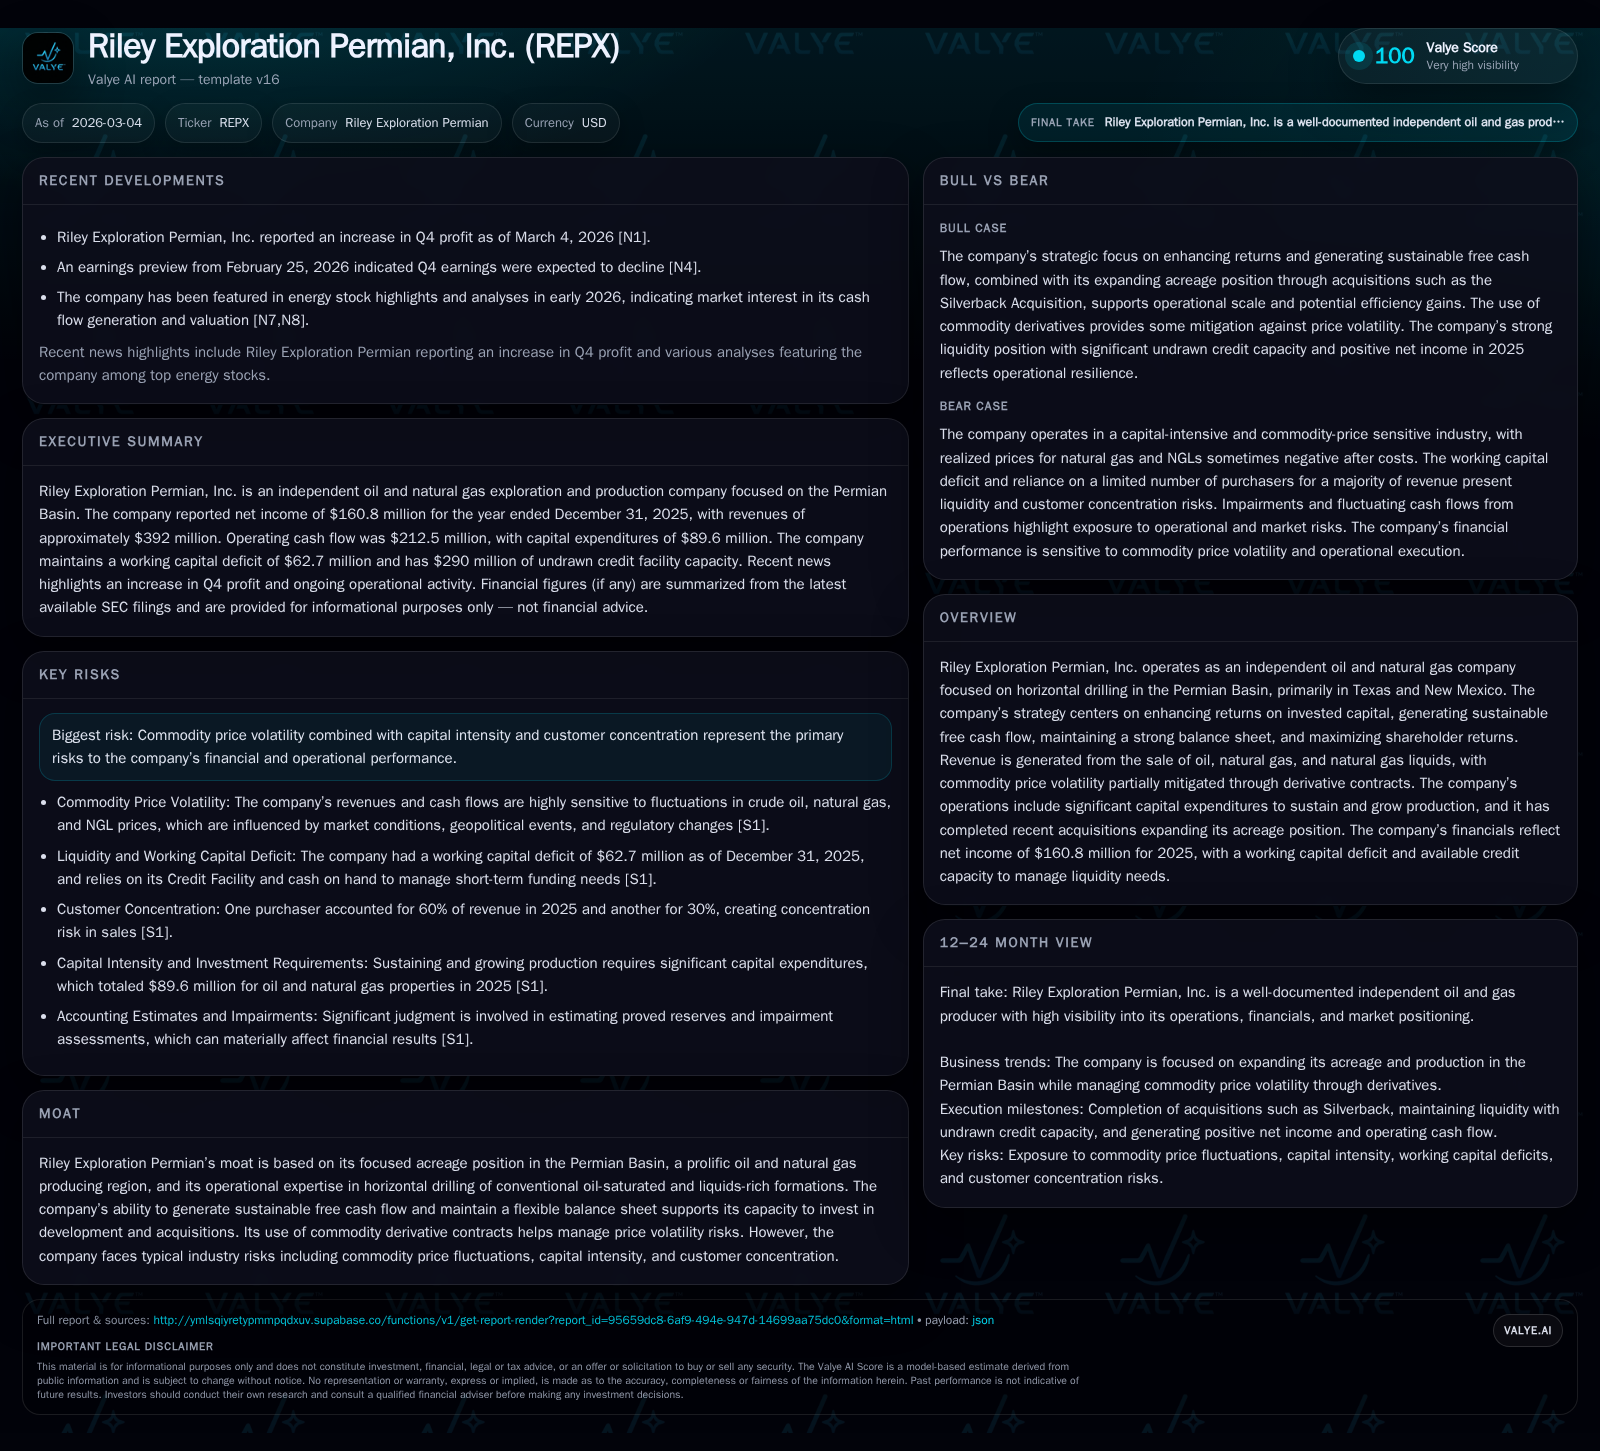
Riley Exploration Permian’s Growth and Cash Flow Dynamics Constrained by Commodity Volatility and Capital Intensity
Focused on horizontal drilling in the Permian Basin, Riley Exploration balances acquisition-driven growth with disciplined capital management amid sector headwinds.
Riley Exploration Permian, Inc. (REPX) operates predominantly in oil-rich horizontal drilling in the Permian Basin with a strategic emphasis on returns and free cash flow generation. While revenue slightly declined in 2025 due to lower commodity prices, net income rose robustly, supported by asset sales and derivative hedges. The company undertook a sizable acreage acquisition and completed a midstream sale that strengthened liquidity amid capital-intensive operations. Despite a working capital deficit and reliance on credit facilities, REPX maintains a resilient balance sheet with manageable leverage and ongoing shareholder returns through dividends. Future growth hinges on production optimization, commodity price trajectories, and further strategic acquisitions within its core Texas-New Mexico footprint.
Company Overview
Riley Exploration Permian, Inc. (REPX) focuses exclusively on horizontal drilling within conventional oil-saturated and liquids-rich formations of the prolific Permian Basin, primarily operating in Yoakum County, Texas, and Eddy County, New Mexico [S1]. Its strategy emphasizes creating returns through capital efficiency, sustainable free cash flow generation, maintaining robust liquidity through prudent balance sheet management, and returning value to shareholders [S1]. Revenue is derived mainly from oil, natural gas, and natural gas liquids sales with partial offsetting of commodity price volatility via derivative contracts [S1]. The company’s operational expertise produces long-life reserves yielding stable cash flows.
Historical Performance
REPX’s financial trajectory reflects volatile commodity markets combined with active asset portfolio management. In fiscal year 2025, total revenue was approximately $392 million—a decline of about 4.4% compared to $410 million in 2024—primarily attributable to softer realized commodity prices [S1][F1]. Operating income declined by roughly 13%, though net income impressively increased by approximately 81% year-over-year to $161 million [F1]. This discrepancy stems chiefly from non-operating gains including a pre-tax gain of $71.7 million related to the sale of midstream assets completed in late 2025 [S1].
Operating expenses rose due to higher production volumes despite lower prices; energy derivatives mitigated some margin erosion as settlements on these contracts increased substantially [S1]. Cash provided by operating activities totaled $212.5 million relative to $246.3 million in the prior year reflecting these mixed dynamics [S1][F1]. Capital expenditures remained largely flat for oil & natural gas properties at about $90 million but included significant spending on midstream infrastructure project construction that was subsequently monetized [S1].
The company’s acquisition strategy continued with the July 2025 Silverback deal involving approximately $123 million paid mostly in cash plus contingent considerations for additional payments up to $3 million [S1]. This added around 40,000 net acres contiguous with existing holdings enhancing scale and operational synergy [S1]. Concurrently REPX divested non-core assets outside its Champions field footprint selling interests for stock consideration that was retired, reducing capital associated risks [S1].
Historical performance (annual)
| FY | Net ($mm) | CFO ($mm) | OpInc ($mm) | Net YoY |
|---|---|---|---|---|
| 2025 | 161 | 213 | 133 | +80.9% |
| 2024 | 89 | 246 | 154 | -20.3% |
| 2023 | 112 | 207 | 172 | -5.4% |
| 2022 | 118 | 204 |
Source: SEC companyfacts cache [F1].
Capital returns and efficiency (annual)
| FY | Div ($mm) | ROE% |
|---|---|---|
| 2025 | 33 | 25.4 |
| 2024 | 31 | 17.4 |
| 2023 | 28 | 26.5 |
| 2022 | 25 | 35.4 |
Source: SEC companyfacts cache [F1].
Note: Capex approximate derived from textual descriptions; CFO denotes net cash provided by operating activities.
Balance Sheet and Liquidity
As of December 31, 2025, Riley reported total current assets of roughly $94 million against current liabilities of about $157 million resulting in a working capital deficit near $63 million—a modest increase over prior year levels [F1][S1][S16]. The rise reflects additional revenue payables linked to acquisitions and increased income tax liabilities partly offset by improved derivative asset positions due to declining crude prices [S16]. Despite this shortfall, liquidity remains comfortable via a credit facility with borrowing capacity of $400 million of which only $110 million was drawn leaving approximately $290 million undrawn as a significant liquidity buffer [S4][S6][S16].
Total outstanding debt was around $248 million split between credit facility borrowings ($110 million) and senior unsecured notes totaling an effective balance of roughly $138 million after discounts and deferred financing costs [S4][S9][F1]. The senior notes bear interest at an effective rate near 13.4% maturing in April 2028 with quarterly principal amortizations starting in late 2023 [S9][S20]. Financial covenants cap leverage ratios below 3x total debt/EBITDA; currently leveraged within acceptable parameters providing ongoing covenant compliance headroom [S7][S10][S20].
Cash balances increased modestly over the prior year reaching approximately $17.9 million providing some cushion for operational needs alongside revolving credit lines [F1][S16]. Repayments under the credit facility slowed during 2025 as recent acquisition funding was supplemented temporarily by draws but offset later with proceeds from midstream asset sales [S19].
Capital Allocation and Returns
REPX returned capital to shareholders primarily through dividends amounting to about $33.3 million paid out during fiscal year 2025—an increase relative to prior periods demonstrating commitment to shareholder yield despite ongoing investment requirements [F1][S21][S15]. Restricted stock holders also received dividends totaling near $0.3 million. No share buybacks occurred during the year though a repurchase program authorizing up to $100 million was approved late in December without execution reported yet [S15][N7].
The combination of solid net income performance producing an approximate return on equity near 25%, coupled with strong operating cash flow generation exceeding capital spending results in practical free cash flow estimated above $210 million giving flexibility for future debt reduction or reinvestment opportunities [F1].[N6]
Industry and Operational Context
Riley benefits from concentrated operational focus within high-margin horizontal wells targeting conventional formations rich in oil saturation typical for productive zones within Permian sub-basins like Yoakum and Eddy Counties—a competitive advantage leveraged through technical expertise along unconventional drilling technologies mixed with conventional play economics . The company actively hedges portions of its production portfolio using financial derivatives reducing exposure to volatile commodity pricing which remains acutely responsive to OPEC+ decisions, macroeconomic developments, tariff uncertainties, geopolitical tensions, and fluctuating demand-supply fundamentals [S1][S24].
The asset-light approach reinforced by recent midstream divestitures signals strategic prioritization toward core upstream assets while monetizing non-core infrastructure generating immediate liquidity inflows used for deleveraging or acquisitions enhancing reserve base [S1].[N7]
However, exposure persists regarding commodity price swings given limited diversification outside petroleum-based products alongside inherently capital-intensive operations requiring sustained investment cycles that may compress margins if cost inflation outpaces pricing trends—particularly relevant amid persistent inflationary pressures impacting labor costs, service rates, equipment prices as well as elevated interest expense under rising rate environments affecting weighted average cost of capital assumptions [S24].
Outlook & What To Watch For (Analysis)
While explicit forward guidance is not detailed outside broad strategic objectives surrounding maximizing return on invested capital and sustaining free cash flow growth [N3], key performance indicators warrant close attention:
- Production volume trends post-Silverback acquisition become critical for offsetting price headwinds through scale.
- Realized commodity prices relative to market benchmarks given derivative contract coverage.
- Capital expenditure pacing aligned with exploration-development activity balancing short-term profitability against reserve replacement.
- Leverage ratios as influenced by debt repayments or additional borrowing especially considering senior note amortization schedules approaching.
- Progress under share repurchase programs or dividend policy adjustments reflecting confidence or caution regarding underlying cash flow durability.
- Market response to any further acreage acquisitions or potential divestitures revealing growth appetite or portfolio rebalancing.
Sector-wise observation involves watching broader macro factors influencing drilling activity levels across the Permian Basin including rig counts shifts driven by exploration economics and service cost fluctuations impacting well completion timelines.
Conclusion
Riley Exploration Permian delivers solid financial metrics characterized by healthy profits driven partly by strategic divestitures coupled with strong operational free cash flow generation despite revenue pressure from softer commodity pricing throughout fiscal year 2025. Expanding footprint through targeted acquisitions enhances upside potential while disciplined financial management maintains liquidity buffers amidst sector cyclicality typical of upstream oil & gas players operating in premium unconventional basins.
The company's balanced approach between growth investments and shareholder value returns—including dividend increases without offensive share repurchases yet—reflects prudent navigation within an inherently volatile industry environment characterized by capital intensity risks mitigated through hedging and selective portfolio optimization.
Investors should monitor operational efficiencies post-acquisition integration alongside resilience against market swings alongside evolving corporate actions governing capital structure adaptability.
Disclaimer: This report is for informational purposes only based on publicly available data as of March 2026; it does not constitute investment advice or recommendations.
Disclaimer: This is research-only, informational analysis and not investment advice. It may include AI-generated interpretation and general industry context. Always verify important details using primary sources.
Comments