
Seaport Entertainment Group Accelerates Asset Monetization Amid Strategic Expansion
Latest quarterly disclosures reveal Seaport Entertainment's robust net cash position supporting growth initiatives and development opportunities.
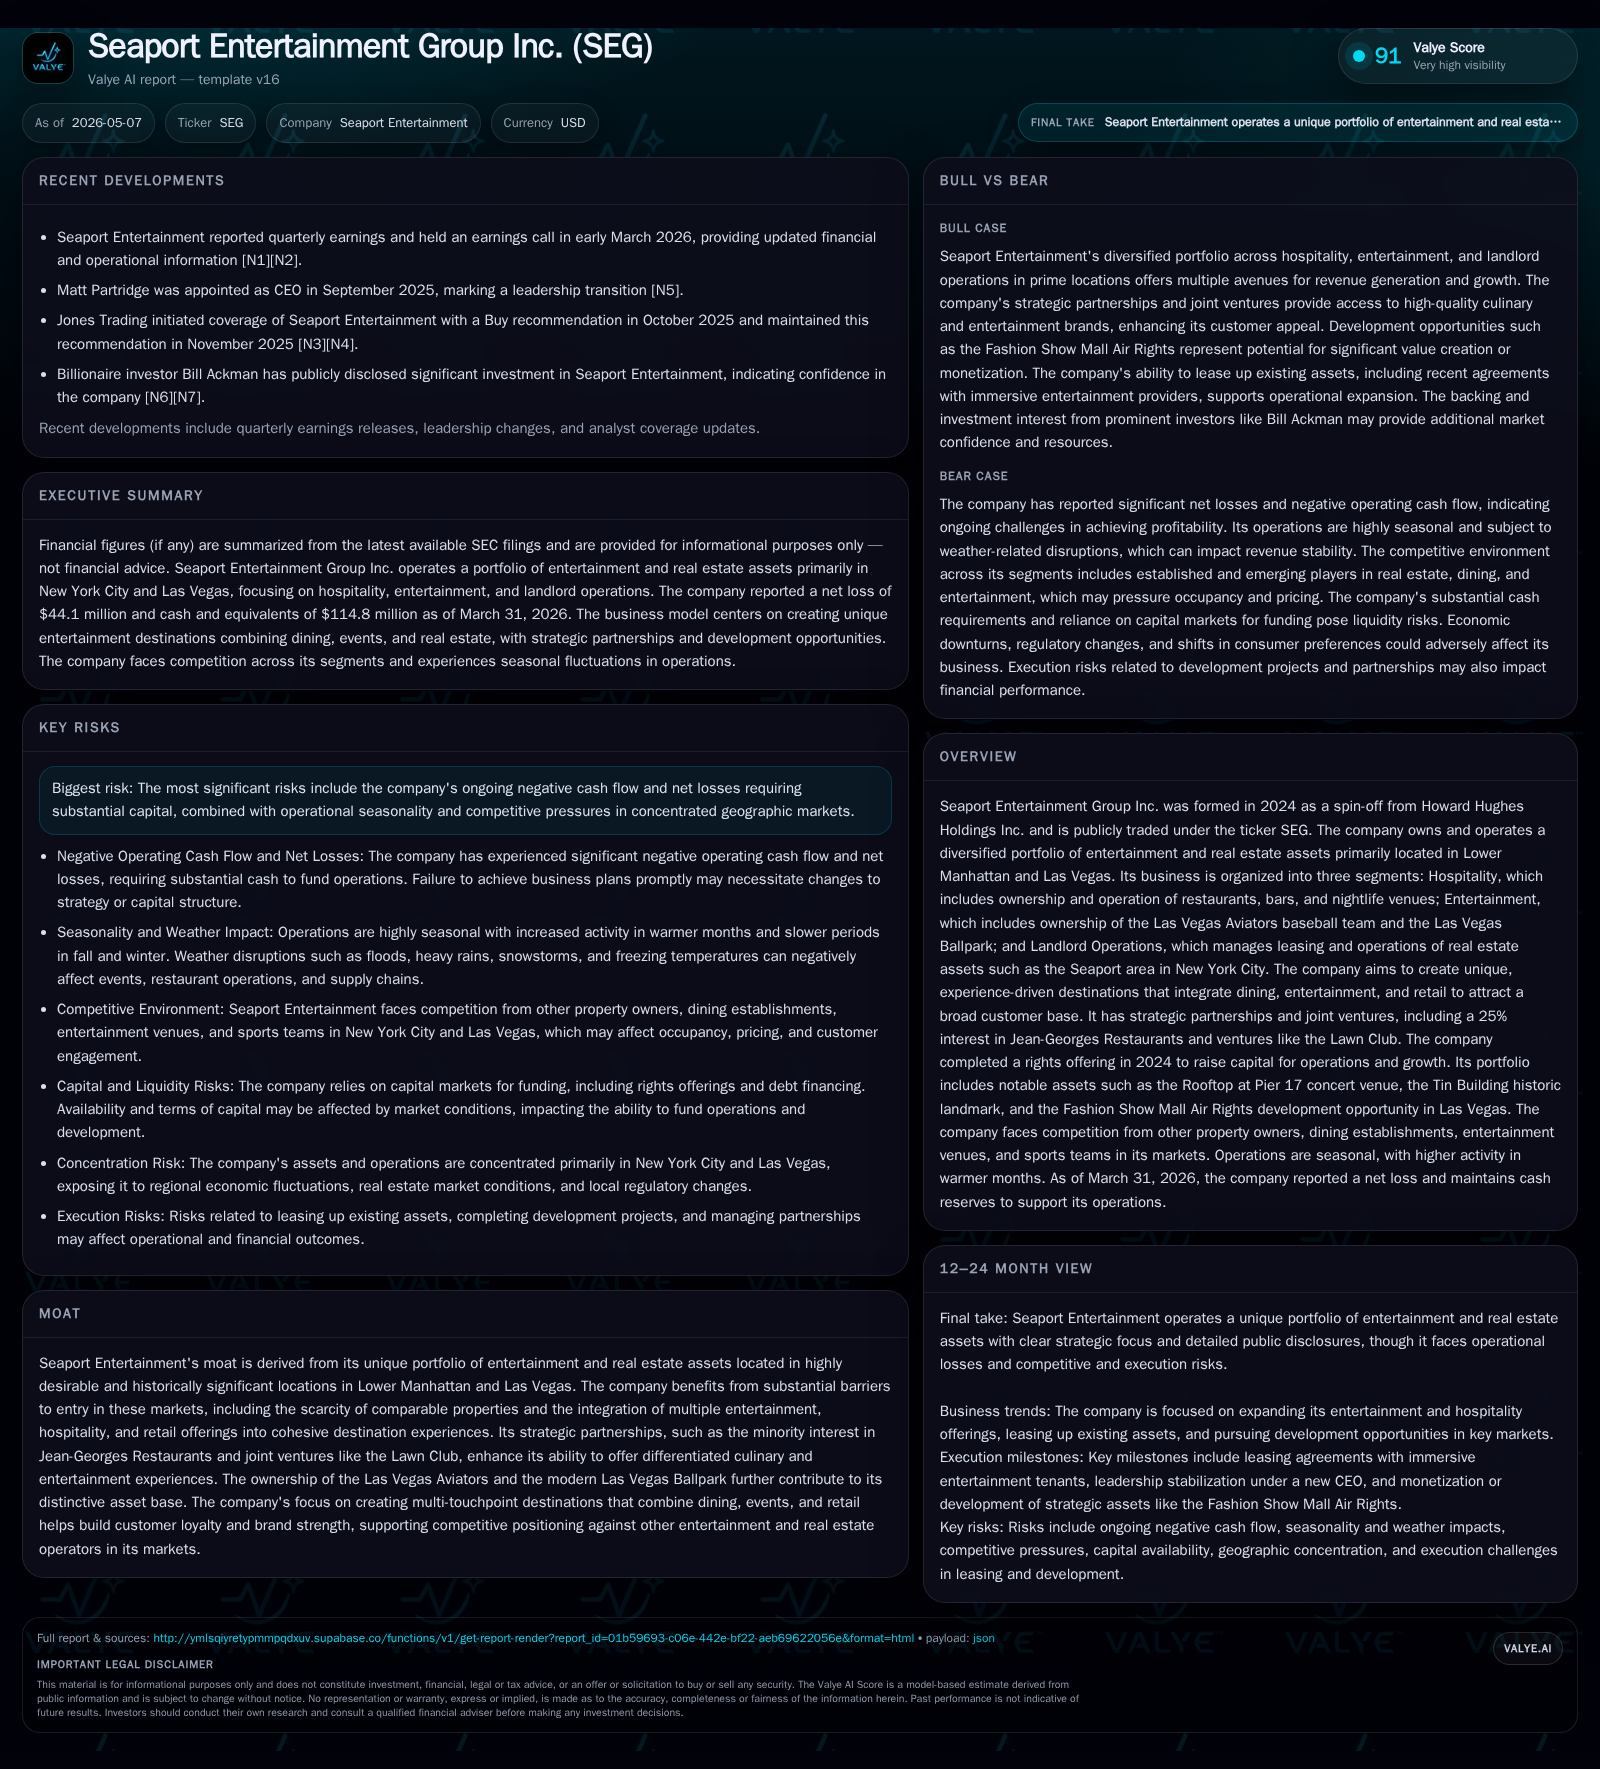
Seaport Entertainment Group's Q1 2026 10-Q highlights a strong liquidity position with $115 million in cash against approximately $38 million in debt, preserving flexibility for strategic growth. The company's diversified portfolio across hospitality, entertainment venues, and prime real estate in New York City's Seaport district and Las Vegas underpins a multi-touchpoint destination model focused on experiential offerings. Growth is further fueled by key partnerships, notably with Jean-Georges Restaurants, and potential monetization of its Fashion Show Mall Air Rights asset. Despite inherent risks including ongoing operating losses and seasonal demand fluctuations, SEG’s distinctive asset base and strategic ventures position it to capitalize on evolving consumer preferences and urban entertainment trends.
Latest Quarterly Operating Highlights
At quarter-end March 31, the company reported $114.8 million of cash and equivalents against total debt of approximately $38.4 million, delivering a net cash position around $76.5 million [F1]. No defaults were reported during the period, nor did any directors or officers change Rule 10b5-1 trading plans, signaling stable governance dynamics [S2]. Proceeds from the 2024 rights offering totaling about $166.8 million remain allocated primarily for general corporate purposes including working capital needs [S2].
Alongside the quarterly financial data, an 8-K concurrently filed on May 6 provided supplemental detail supporting these operational disclosures without material revisions to guidance or capital deployment strategies [S3]. These updates affirm management’s commitment to leveraging existing capital durability while advancing growth initiatives embedded in its unique asset portfolio.
Business Model and Asset Composition
Formed in 2024 as a spin-off from Howard Hughes Holdings Inc., Seaport Entertainment has organized its operations into three segments: Hospitality; Entertainment; and Landlord Operations [S1]. The Hospitality segment manages restaurants, bars, and nightlife venues predominantly clustered within New York City’s revitalized Seaport district—a historic waterfront area undergoing transformation into an experiential retail and entertainment hub. This segment benefits from partnerships with renowned culinary operators including a minority interest in Jean-Georges Restaurants, embedding premium appeal within its dining assets.
The Entertainment segment centers on ownership and operation of sports franchises like the Las Vegas Aviators baseball team alongside the adjacent modern Las Vegas Ballpark facility [S1]. These venues serve dual roles as income-generating assets through ticketing/sponsorships while amplifying foot traffic for integrated hospitality services.
In Landlord Operations, SEG controls leasing and property management for its diverse real estate assets. Significant holdings include both residential/commercial properties within Lower Manhattan's Seaport vicinity alongside assets in Las Vegas [S1]. A distinctive component is the company’s sizable air rights over the Fashion Show Mall site—a prospective development opportunity projected to provide substantial monetization or long-term growth through phased real estate projects [S1]. This planned utilization reflects an intention to capitalize more aggressively on its real estate portfolio beyond traditional landlord income.
Strategically, SEG aims to orchestrate multi-touchpoint destination experiences that tightly weave together dining, retail, sports/events, and hospitality offerings into cohesive consumer journeys favoring extended stays and higher spend per visit. This integration enhances customer stickiness while diversifying revenue sources against cyclical pressures affecting any single line of business.
Competitive Position in Entertainment and Real Estate
Seaport Entertainment occupies rarefied ground with assets located in historically significant waterfront districts undergoing redevelopment: New York's Seaport District—scarce for similarly scaled commercial/residential real estate—and Las Vegas—a dynamic market for sports/entertainment consumption [S1]. This geographic scarcity creates inherent barriers limiting new entrants competing on comparable terms.
Within NYC’s entertainment ecosystem, SEG competes against venues ranging from intimate clubs to large arenas offering varied event types. The company’s integration of curated dining options coupled with venue ownership distinguishes it by offering differentiated experiences that compete on atmosphere and amenities rather than just pure capacity or ticket price [S1].
In Las Vegas' sports market segment, where sports franchises must vie for fan engagement amidst numerous entertainment alternatives (casinos, concerts), owning both the team (Aviators) and stadium (Ballpark) supports brand loyalty initiatives that enhance sponsorship appeal—a critical revenue driver distinct in this fragmented market [S1].
Joint ventures such as the Lawn Club complement segmented offerings via exclusive social or culinary events boosting overall ecosystem attractiveness. Thus SEG’s blend of operational control plus selective partnerships consolidates market positioning across its chosen geographies.
Growth Drivers: Development, Partnerships, and Market Dynamics
Among prominent growth catalysts is the Fashion Show Mall Air Rights parcel development opportunity documented in annual filings [S1]. If transacted effectively—either through direct development or monetization—the project could materially augment future revenue streams beyond existing rental leases.
SEG also leverages strategic partnerships—Jean-Georges Restaurants minority interest serves as a powerful culinary anchor elevating dining experiences within their hospitality portfolio, contributing to pricing power amid heightened consumer expectations for high-profile food destinations.
Demand drivers appear partly structural given rising preference for urban experience-oriented leisure post-pandemic coupled with increasing consumer willingness to spend selectively on multi-faceted destinations blending retail/hospitality/events.
Seasonal spikes linked to sporting events at Las Vegas Ballpark combined with special programming at NYC venues provide cyclical volume uplifts complementing stable base demand from local patrons/residents. Capturing these dynamics entails optimized event scheduling alongside enhanced marketing alignment among venue operations.
This nexus of real estate development upside plus curated culinary/entertainment ecosystems positions SEG to grow organically via increased foot traffic/consumer spend supported by selective capital deployment informed by measured yield expectations.
Risks and Constraints: Cash Flow, Seasonality, and Market Competition
As highlighted in risk disclosures incorporated by reference into the latest quarterly report [S2] and reinforced by annual filings [S7], ongoing negative operating cash flow represents a significant challenge requiring the company to maintain access to capital markets or internal liquidity cushions.
Losses recorded stand near -$118 million operating income as of FY2025 year-end [F1], underscoring execution urgency along revenue ramp initiatives or cost containment efforts required to approach profitability sustainably.
Segment performance inherently faces seasonal demand fluctuations—leisure demand peaks tied to warmer months or event seasons contrast with quieter periods impacting hospitality turnover particularly sensitive in NYC urban tourism-centric settings.
Additionally, competitive pressures derive from both entrenched local venues competing heavily on amenities/pricing alongside national/regional players vying for sponsorships or entertainment dollars especially in Las Vegas’ crowded marketplace [S1]. High fixed costs of urban waterfront properties compound margin risks if occupancy dips unexpectedly.
Finally regulatory environment shifts including zoning restrictions or operational permits in dense urban centers introduce execution uncertainties around future developments or expansions critical for long-term growth aspirations.
Key Near-Term Milestones and Indicators
Stakeholders should prioritize monitoring several indicators emanating from recent filings:
- Progress updates on substantive monetization steps or development milestones concerning Fashion Show Mall Air Rights deals disclosed in annual reports [S1] remain crucial credit triggers.
- Attendance trends at Las Vegas Aviators games together with event bookings within NYC hospitality-entertainment venues serve as volume proxies validating demand assumptions embedded within strategic plans [S3][S2].
- Occupancy rates alongside average spend metrics across flagship restaurant/nightlife properties anchored by JG partnerships reflect consumer acceptance of experiential upgrades fueling pricing leverage.
- Management commentary relating to usage of remaining rights offering proceeds informs liquidity sufficiency relative to operating burn cadence observed through trailing quarters.
- Any amendments or changes related to debt covenants or capital structure announcements signal evolving balance sheet flexibility impacting future investment capacity.
Successful navigation of these milestones will shape narrative arcs around SEG’s pathway toward profitable scaling amid capital-intensive industry realities.
Financial Snapshot: Liquidity, Debt, and Profitability Overview
Latest financial snapshot
| Metric | Value | Period |
|---|---|---|
| Cash & equivalents | $115mm | |
| 2026-03-31 | ||
| Total debt | $38mm | |
| 2026-03-31 | ||
| Net debt | $-76mm | |
| 2026-03-31 |
Source: SEC companyfacts cache [F1].
| Metric | Value | Period End |
|---|---|---|
| Cash & Equivalents | $114.8 million | |
| 2026-03-31 | ||
| Total Debt | $38.4 million | |
| 2026-03-31 | ||
| Operating Income | -$118.2 million | |
| 2025-12-31 | ||
| Net Income | -$116.7 million | |
| 2025-12-31 |
This snapshot encapsulates SEG’s financial positioning: a net cash status driven by ample liquidity versus comparatively modest debt provides operational leverage amidst persistent net losses reflecting ongoing scale-up costs [F1]. Prudent capital allocation moving forward will be pivotal given cash flow deficits necessitating disciplined expense management paired with accelerated revenue growth.
DISCLAIMER: This analysis is based entirely on publicly available SEC filings as referenced herein without any insider information. It does not constitute investment advice or recommendations but seeks solely to synthesize verified data into an independent industry-informed perspective tailored for internal use.
Disclaimer: This is research-only, informational analysis and not investment advice. It may include AI-generated interpretation and general industry context. Always verify important details using primary sources.
Comments