
Sleep Number’s Recovery Strategy Tested by Operating Loss and Liquidity Pressures
Sleep Number confronts a steep sales decline and liquidity challenges while implementing a turnaround focused on product simplification, marketing modernization, and distribution optimization.
Sleep Number, known for its innovative smart mattresses and proprietary digital sleep platform, faced a pronounced setback in 2025 with a 16% revenue drop and operating loss amid deteriorating retail traffic and industry headwinds. Despite substantial cost reductions totaling $136 million and a newly established ‘Sleep Number Shifts’ turnaround strategy, the company is challenged by severe liquidity constraints and substantial doubt about its ability to continue as a going concern. The amended credit facility provides temporary relief via covenant adjustments and debt maturity extension, but the company’s recovery depends on execution risks surrounding its repositioning efforts and access to capital.
Innovation-Moat and Consumer Experience: Foundation Before the Downturn
Sleep Number's core differentiation lies in its patented smart mattress technology that integrates adjustable firmness, pressure-relieving support, temperature balancing comfort, and embedded AI-driven sensors—what management terms “sense and do” technology [S1][S9]. With over 1,000 patents worldwide underpinning this innovation backed by billions of hours of longitudinal sleep data collected from more than 16 million users, the company's technology moat is significant.
This moat is complemented by its vertically integrated model controlling design through manufacturing to delivery across approximately 600 direct-to-consumer stores plus online platforms [S9]. This exclusive distribution setup enables superior quality control and an enhanced customer journey facilitated by SleepIQ® technology delivering personalized daily sleep insights. The company boasts high customer engagement with about 80% monthly active use among Smart Sleepers—loyal consumers who reinforce brand advocacy [S9]. Strategic partnerships like the Official Sleep + Wellness Partner of the NFL boost credibility and consumer awareness.
Financial Trajectory: From Strong Growth to a Sharp Earnings Decline in 2025
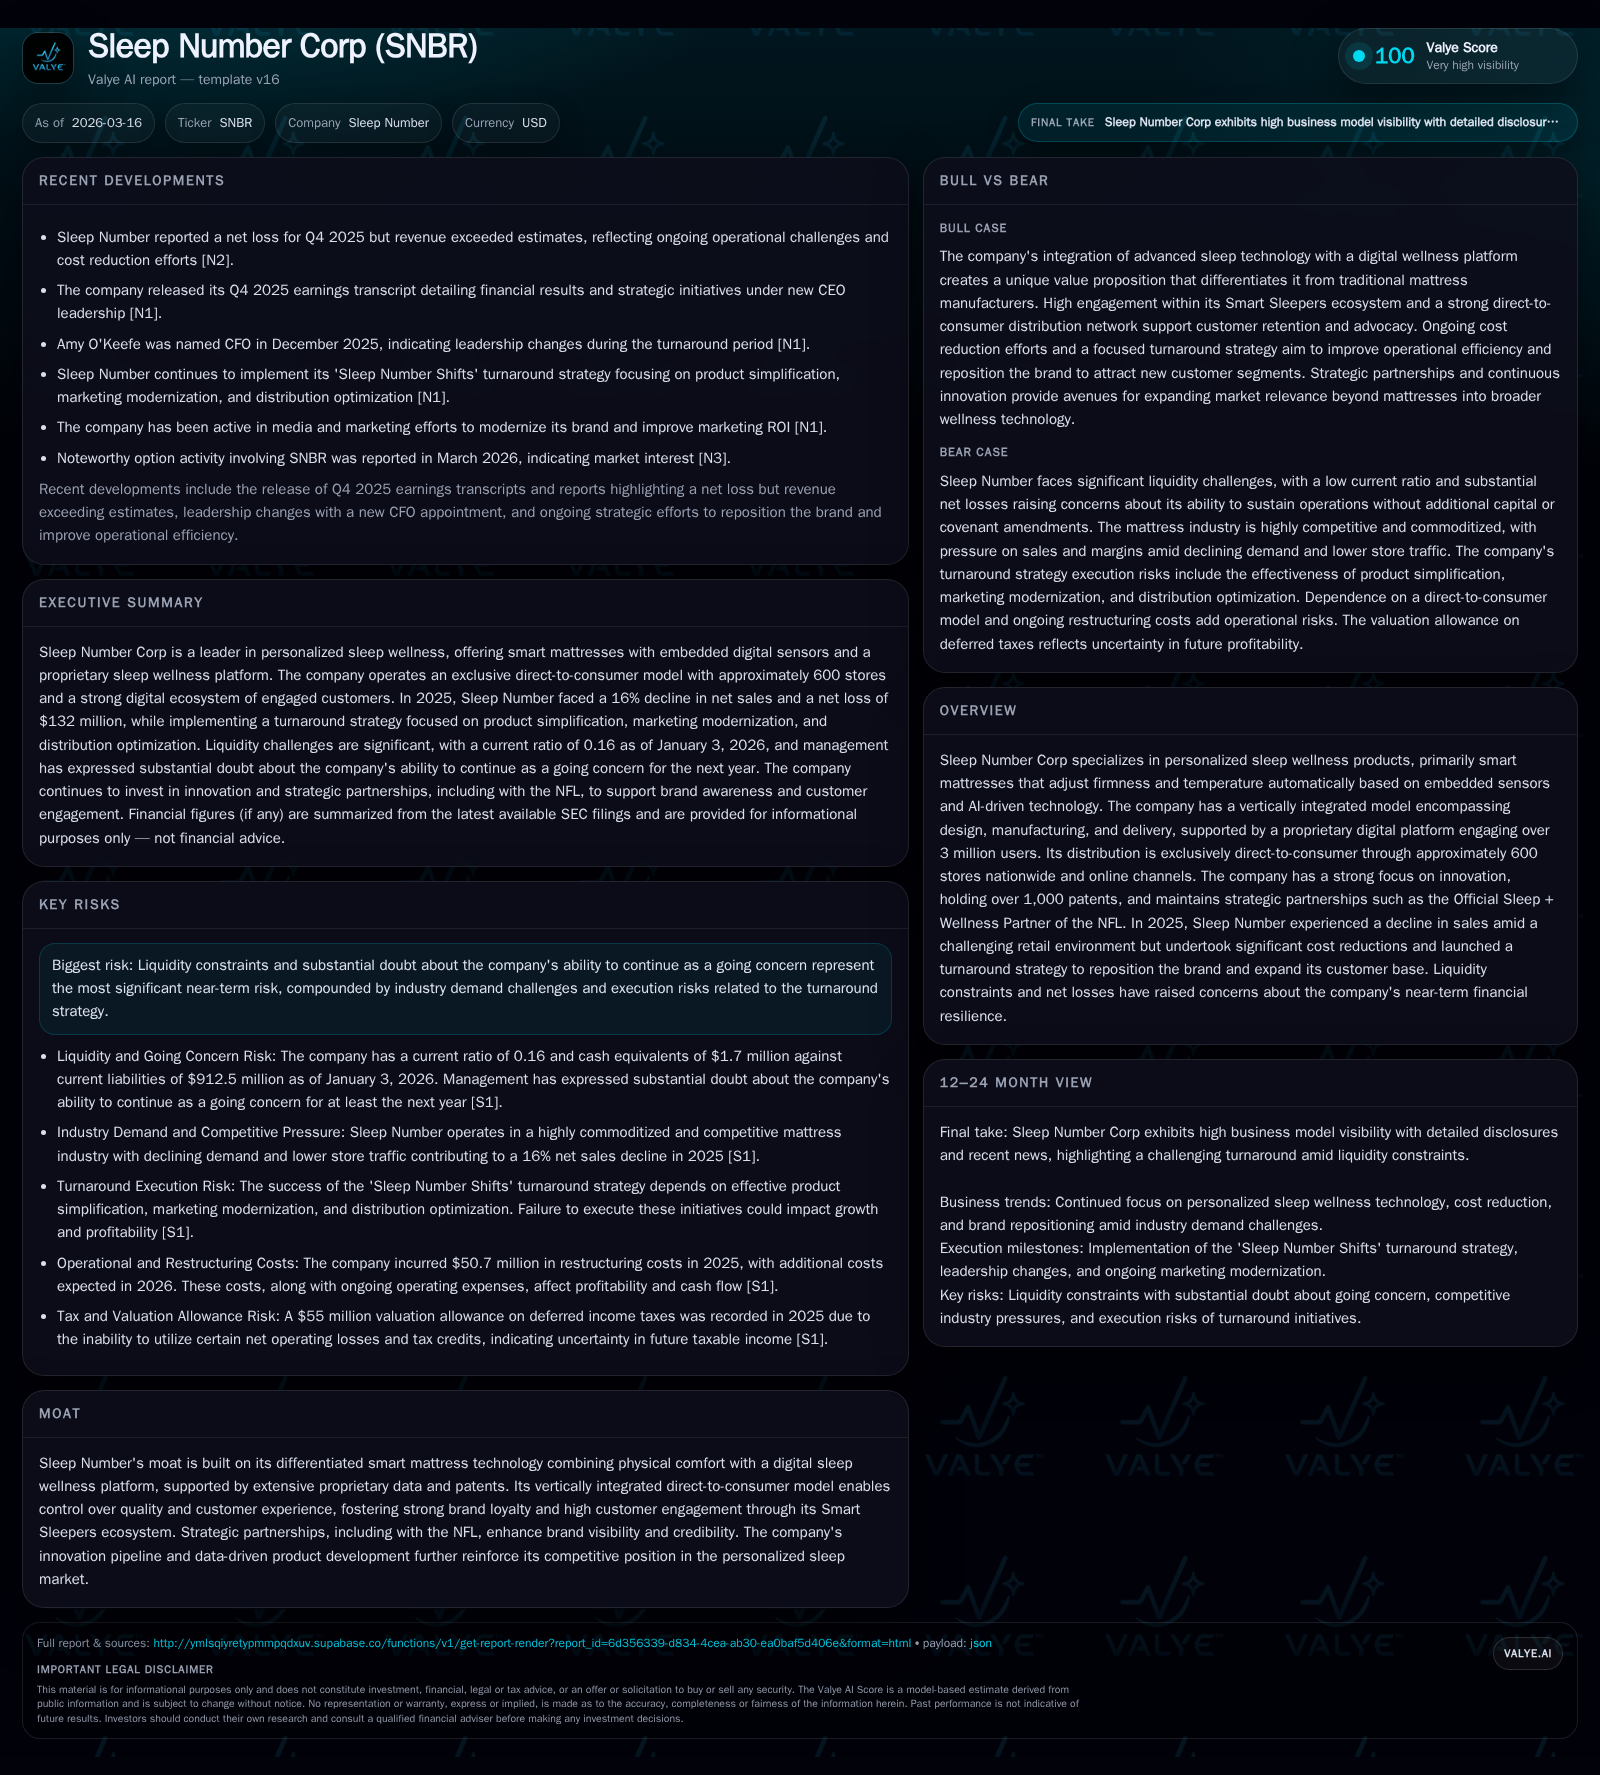
Sleep Number enjoyed robust growth until fiscal year 2024 but reversed sharply in fiscal 2025 when sales contracted by approximately 16%, triggering operating losses [F1][S1]. The table below chronicles key annual financial metrics from FY2017 through FY2025 as reported:
Historical performance (annual)
| FY | Net ($mm) | CFO ($mm) | OpInc ($mm) | Capex ($mm) | Net YoY |
|---|---|---|---|---|---|
| 2025 | -132 | -3 | -47 | 14 | -549.0% |
| 2024 | -20 | 27 | 23 | 24 | -33.0% |
| 2023 | -15 | -9 | 23 | 57 | -141.8% |
| 2022 | 37 | 36 | 68 | 69 |
Source: SEC companyfacts cache [F1].
Capital returns and efficiency (annual)
| FY | Buybacks ($mm) | FCF ($mm) | ROE% |
|---|---|---|---|
| 2025 | 1 | -18 | 22.8 |
| 2024 | 1 | 4 | 4.5 |
| 2023 | 4 | -66 | 3.5 |
| 2022 | 64 | -33 | -8.4 |
Source: SEC companyfacts cache [F1].
Fiscal year 2025’s operating loss of $47 million starkly contrasts with positive operating income near $23 million just one year prior [F1]. Similarly, net loss surged to $132 million driven by weakening revenues compounded by impairment charges totaling approximately $31 million related to lease right-of-use assets and strategic partner long-lived assets [S12]. The decline in operating cash flow reversing from positive $27 million to negative $3.3 million further underscores operational deterioration with sustained capex spending at $14.4 million aimed at maintaining infrastructure [F1][S17][S18].
Analyzing the Sales Decline: Retail Traffic, Industry Pressures, and Store Productivity
The principal driver behind revenue contraction was an adverse retail environment characterized by lower foot traffic across the company's roughly 600 storefronts nationwide—all under exclusive direct-to-consumer control [S9]. Comparable store sales fell approximately 17%, lowering average annual net sales per fully operational store from about $2.6 million in prior years to roughly $1.9 million in 2025 [S9][N1][N2].
Management highlighted ongoing industry-wide demand softness exacerbated by shifting consumer shopping behavior towards online platforms where Sleep Number represents around 12% of net sales but is seeking expansion [N1][S9]. Pricing strategies faced pressure despite price enhancements enabled by value engineering and supplier negotiations that slightly offset gross margin contraction (59% gross profit rate down ~0.6 ppt.) [S11][S17]. Reduced store productivity directly impacted top-line results amidst broader macroeconomic headwinds.
Liquidity Constraints and Credit Facility Headwinds
Liquidity pressure stands out as one of Sleep Number’s most critical contemporary challenges with only $1.7 million cash on hand against current liabilities exceeding $912 million yielding an alarming current ratio around 0.16—a severe short-term solvency risk [F1][S4][S10].
The company maintains borrowings totaling approximately $588 million under a revolving credit facility capped at $655 million that was amended recently to extend maturity through December 2027 while tightening financial covenants including leverage ceilings and minimum interest coverage ratios [S5][S6]. Notable amendments include raising scheduled amortization payments starting March 31, 2027, reducing revolver availability gradually from $475 million to $465 million mid-2026, plus updated pricing grids on interest margins reflective of elevated risk premiums [S6][S10].
Despite compliance with amended covenants as of early calendar year-end (leverage ~4.1x vs permitted max ~4.5x), management openly acknowledges substantial doubt regarding continuing as a going concern due to insufficient projected cash flows absent successful turnaround delivery or capital raise initiatives [S4][S22].
The "Sleep Number Shifts" Turnaround Strategy: Product, Marketing, Distribution Focus
In response to operational pressures, newly appointed CEO Linda Findley initiated the "Sleep Number Shifts" program emphasizing three pillars:
- Product Simplification: Streamlined product portfolio aimed at broadening market appeal while leveraging strong repeat purchase demand among loyal users.
- Marketing Modernization: Expanding channel breadth beyond traditional approaches coupled with creative renewal designed for higher engagement efficiency measured via ROI metrics.
- Distribution Optimization: Strategically right-sizing the physical store footprint complemented by exploring new channels digitally and via third-party partnerships.
This multi-pronged approach also coincides with execution of real estate cost optimizations and workforce consolidations yielding incremental operating expense savings totaling an additional $136 million excluding restructuring costs [S1][N1][S24]. However, execution remains delicate under cash shortages that could strain investment appetite pivotal for lifting brand relevance or scaling up new channel investments.
Capital Allocation Trends: Minimal Buybacks Amid Cash Flow Shortage and Shrinking Equity
Capital return activity has essentially ceased as the company prioritizes liquidity preservation; only nominal share repurchases (~$1.2 million) occurred in fiscal year-end reflecting employee stock vesting transactions rather than discretionary buybacks [F1][S7]. A board-authorized repurchase program remains dormant with approximately $348 million authorization left unused.
Meanwhile, equity erosion accelerates—the shareholders' deficit widened to approximately -$578 million largely fueled by cumulative net losses including last year's sizeable deficiency [F1]. Return metrics such as adjusted ROIC swung heavily negative (-4%) from prior positive territory underscoring capital inefficiency aligned with unprofitability challenges [S18][S17].
Capex levels have moderated compared to historical peaks ($14.4M vs prior years up to ~$69M), aligning investments primarily towards sustaining existing assets rather than expansionary projects reflecting cautious prudence given financial constraints [F1][S17]. Such capital discipline coexists with negative free cash flow approximating -$18M (operating cash flow minus capex) evidencing ongoing cash consumption contrary to earnings pressures.
What to Watch: Covenant Negotiations, Store Footprint Changes, and Expansion into New Channels
Looking ahead, material catalysts include:
- Continued lender dialogue aiming for covenant waivers or further amendments given looming financial metric breaches projected per management projections absent accelerating growth or infusion events [N1][S4][S6].
- Monitoring outcomes from optimizing the store network—whether closures or resizing improve per-store profitability without excessive fixed cost drag.
- Success in diversifying distribution beyond brick-and-mortar normalized performance such as expanding e-commerce penetration or partnerships inline with shifting consumer purchase patterns.
- Impacts from ongoing market conditions or macroeconomic shifts affecting consumer discretionary spend on premium sleep products remain important considerations.
Given existing liquidity challenges articulated by auditors’ going concern assessment coupled with strategic realignment still early-stage post-CEO transition this juncture represents high operational risk where execution speed and scope will be critical determinants of recovery trajectory visibility [S4][N1].
This analysis synthesizes reported financial disclosures from SEC filings alongside recent earnings commentary without providing investment advice or forecasts beyond disclosed management guidance. Readers should consider all risks embedded within Sleep Number's liquidity profile and turnaround strategy execution when evaluating the company's business developments.
Disclaimer: This is research-only, informational analysis and not investment advice. It may include AI-generated interpretation and general industry context. Always verify important details using primary sources.
Comments