
Transcontinental Realty Investors' Earnings Rebound and Cash Flow Challenges in 2025
An analysis of TCI’s modest revenue growth alongside continued operating losses, a significant net income turnaround, and ongoing cash flow constraints in fiscal 2025.
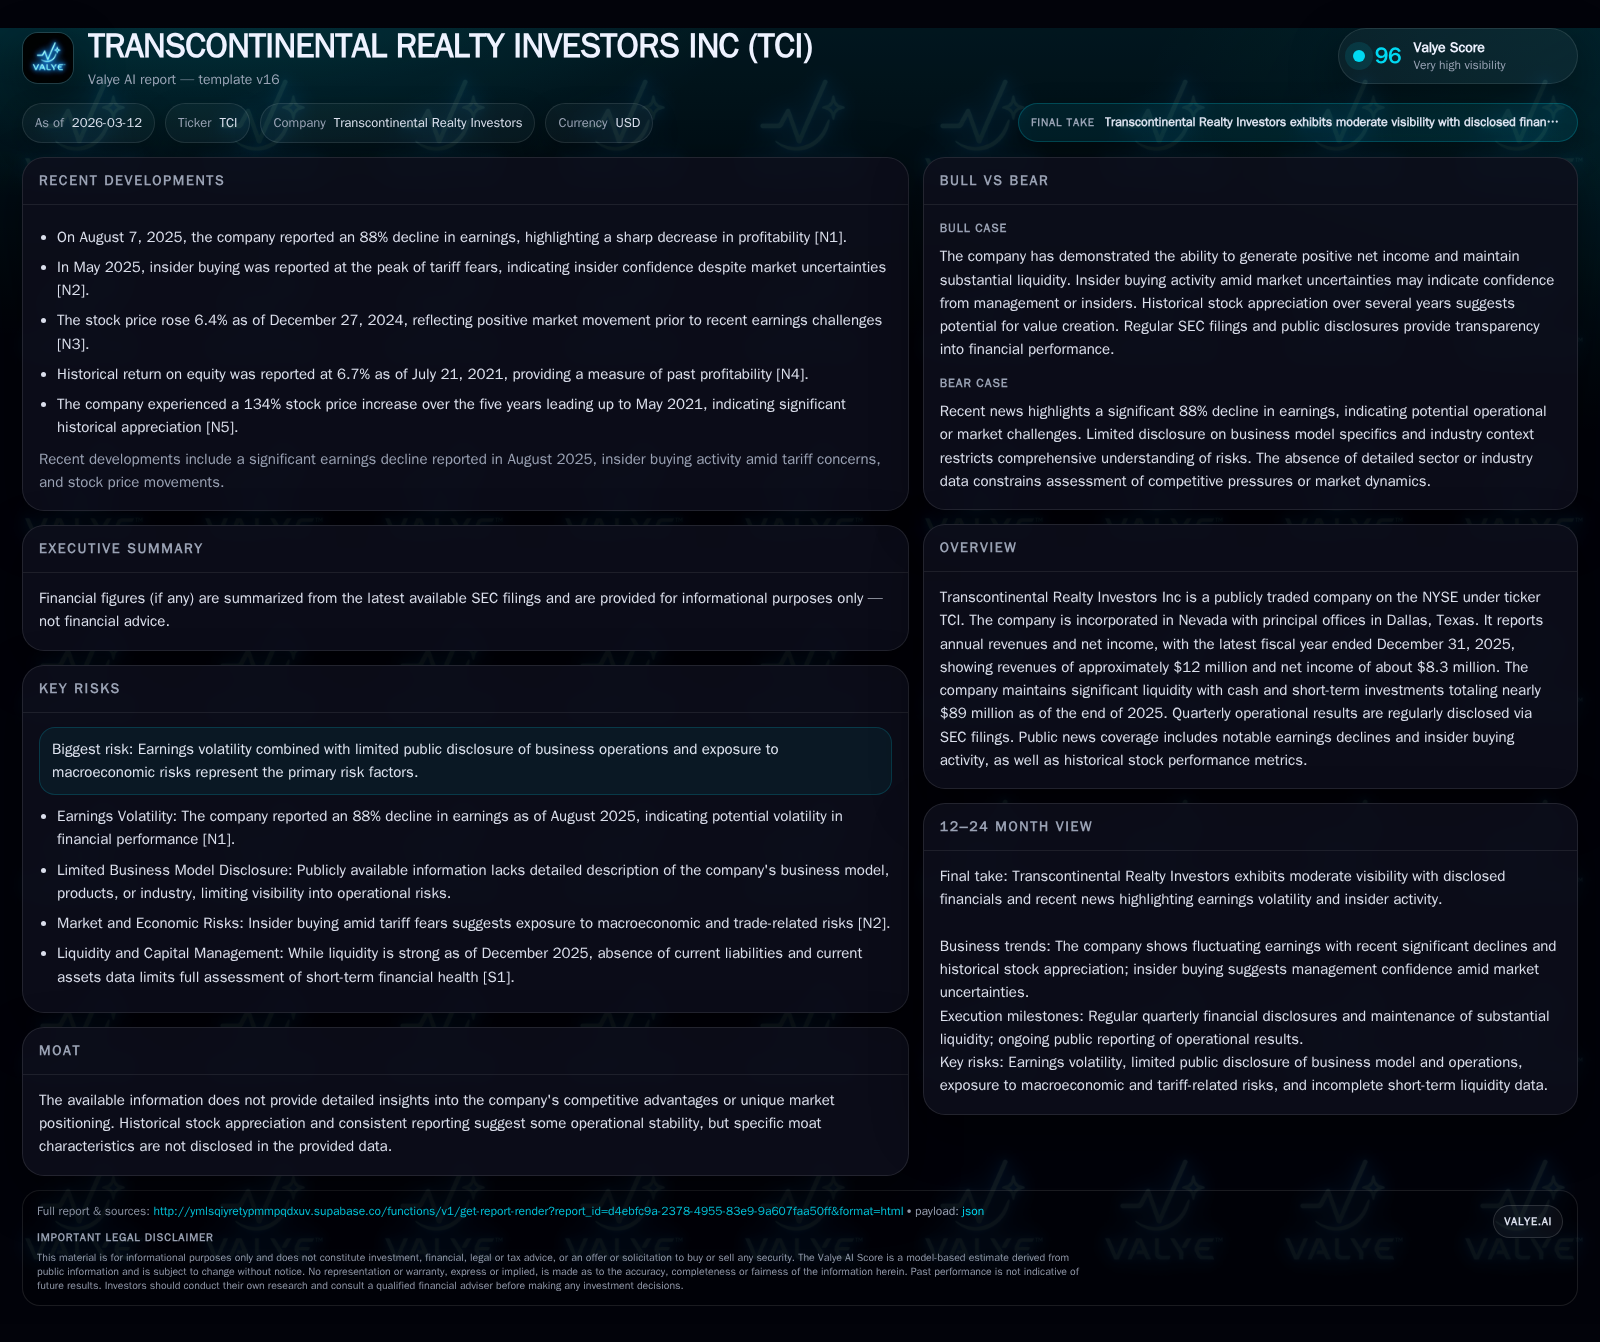
Transcontinental Realty Investors Inc reported revenues of $12.06 million in 2025, marking a 2.3% increase from the prior year. The company posted a net income of $8.29 million, reversing prior losses, despite operating income remaining negative at -$3.49 million. Operating cash flow declined to -$2.89 million, contributing to an estimated free cash flow deficit driven by capital expenditures. The balance sheet remains solid with cash and equivalents of $14.07 million and equity exceeding $846 million. Capital allocation included share repurchases of approximately $1.08 million amid constrained cash flows. Risk disclosures highlight earnings volatility and macroeconomic sensitivities as factors to monitor.
Revenue and Earnings Overview
Transcontinental Realty Investors Inc reported revenues of $12.06 million for fiscal year 2025, representing a modest increase of 2.3% compared to $11.79 million in 2024 [F1]. This follows a period of revenue decline from $13.45 million in FY2023 to $11.79 million in FY2024 [F1].
The company recorded a net income of approximately $8.29 million in 2025, reversing prior losses and near breakeven results from previous years ($108 thousand net income in FY2024) [F1]. This represents a significant improvement though the underlying operational performance tells a more nuanced story.
Operating Income and Performance
Operating income remained negative for the fourth consecutive year at -$3.49 million in 2025, worsening from -$1.69 million in the prior year [F1]. This continued operating loss contrasts sharply with the positive net income outcome, suggesting that non-operating items materially contributed to profitability.
Limited disclosure on business segment details or exceptional items precludes deeper analysis but persistent operating losses highlight ongoing challenges within core operations [S1][S8].
Cash Flow and Free Cash Flow Dynamics
Operating cash flow turned negative again at approximately -$2.89 million in 2025 compared with positive $1.31 million in 2024 [F1]. This marks a substantial deterioration and indicates difficulties converting earnings into cash.
Capital expenditures have decreased relative to historical levels but remain sufficient to drive free cash flow into negative territory; an estimated free cash flow deficit exceeds $13 million when combining latest available CFO and capex data [F1]. These cash flow trends underscore liquidity management pressures despite reported net profits.
Balance Sheet Strength
The company's financial position remains strong with cash and equivalents totaling $14.07 million at December 31, 2025, supported by equity exceeding $846 million [F1]. This robust base provides resilience against short-term fluctuations and supports capital deployment activities despite operating and cash flow challenges.
Capital Allocation
Capital allocation during fiscal 2025 included share repurchases totaling approximately $1.08 million, an increase from about $802 thousand in the prior year [F1]. These buybacks occurred amid constrained free cash flow conditions, implying reliance on existing liquidity reserves rather than organic cash generation.
Dividend policies are not explicitly detailed within recent filings [S9][S14], but maintaining distributions would require balancing given the disconnect between accounting profits and actual cash flows.
Risk Factors and Outlook
Risk disclosures emphasize earnings volatility, limited public operational transparency, and sensitivity to macroeconomic factors such as interest rates and real estate market cycles that could materially affect future results [S4][S6][S7]. Legal proceedings do not currently present material contingencies but remain an area for ongoing monitoring [S4][S5].
Historical Financial Summary
Historical performance (annual)
| FY | Rev ($mm) | Net ($mm) | CFO ($mm) | OpInc ($mm) | Rev YoY | Net YoY |
|---|---|---|---|---|---|---|
| 2025 | 12 | 8 | -3 | -3 | +2.3% | +7577.8% |
| 2024 | 12 | 0 | 1 | -2 | -12.4% | +104.2% |
| 2023 | 13 | -3 | -31 | -2 | +5.2% | -104.3% |
| 2022 | 13 | 59 | -45 | 0 |
Source: SEC companyfacts cache [F1].
Capital returns and efficiency (annual)
| FY | Buybacks ($) | ROE% |
|---|---|---|
| 2025 | 1082000 | 1.0 |
| 2024 | 802000 | 0.0 |
| 2023 | 908000 | -0.3 |
| 2022 | 7.2 |
Source: SEC companyfacts cache [F1].
This overview reflects Transcontinental Realty Investors’ complex financial profile characterized by an encouraging earnings rebound tempered by ongoing operational losses and significant liquidity constraints amid a strong balance sheet foundation.
Disclosure: This report is provided for informational purposes only without any investment advice or recommendations.
Disclaimer: This is research-only, informational analysis and not investment advice. It may include AI-generated interpretation and general industry context. Always verify important details using primary sources.
Comments