
Struggles and Steps Forward in Lifetime Brands’ Financial Performance
The company shows revenue resilience while grappling with escalating losses and managing liquidity amid uncertain profitability recovery.
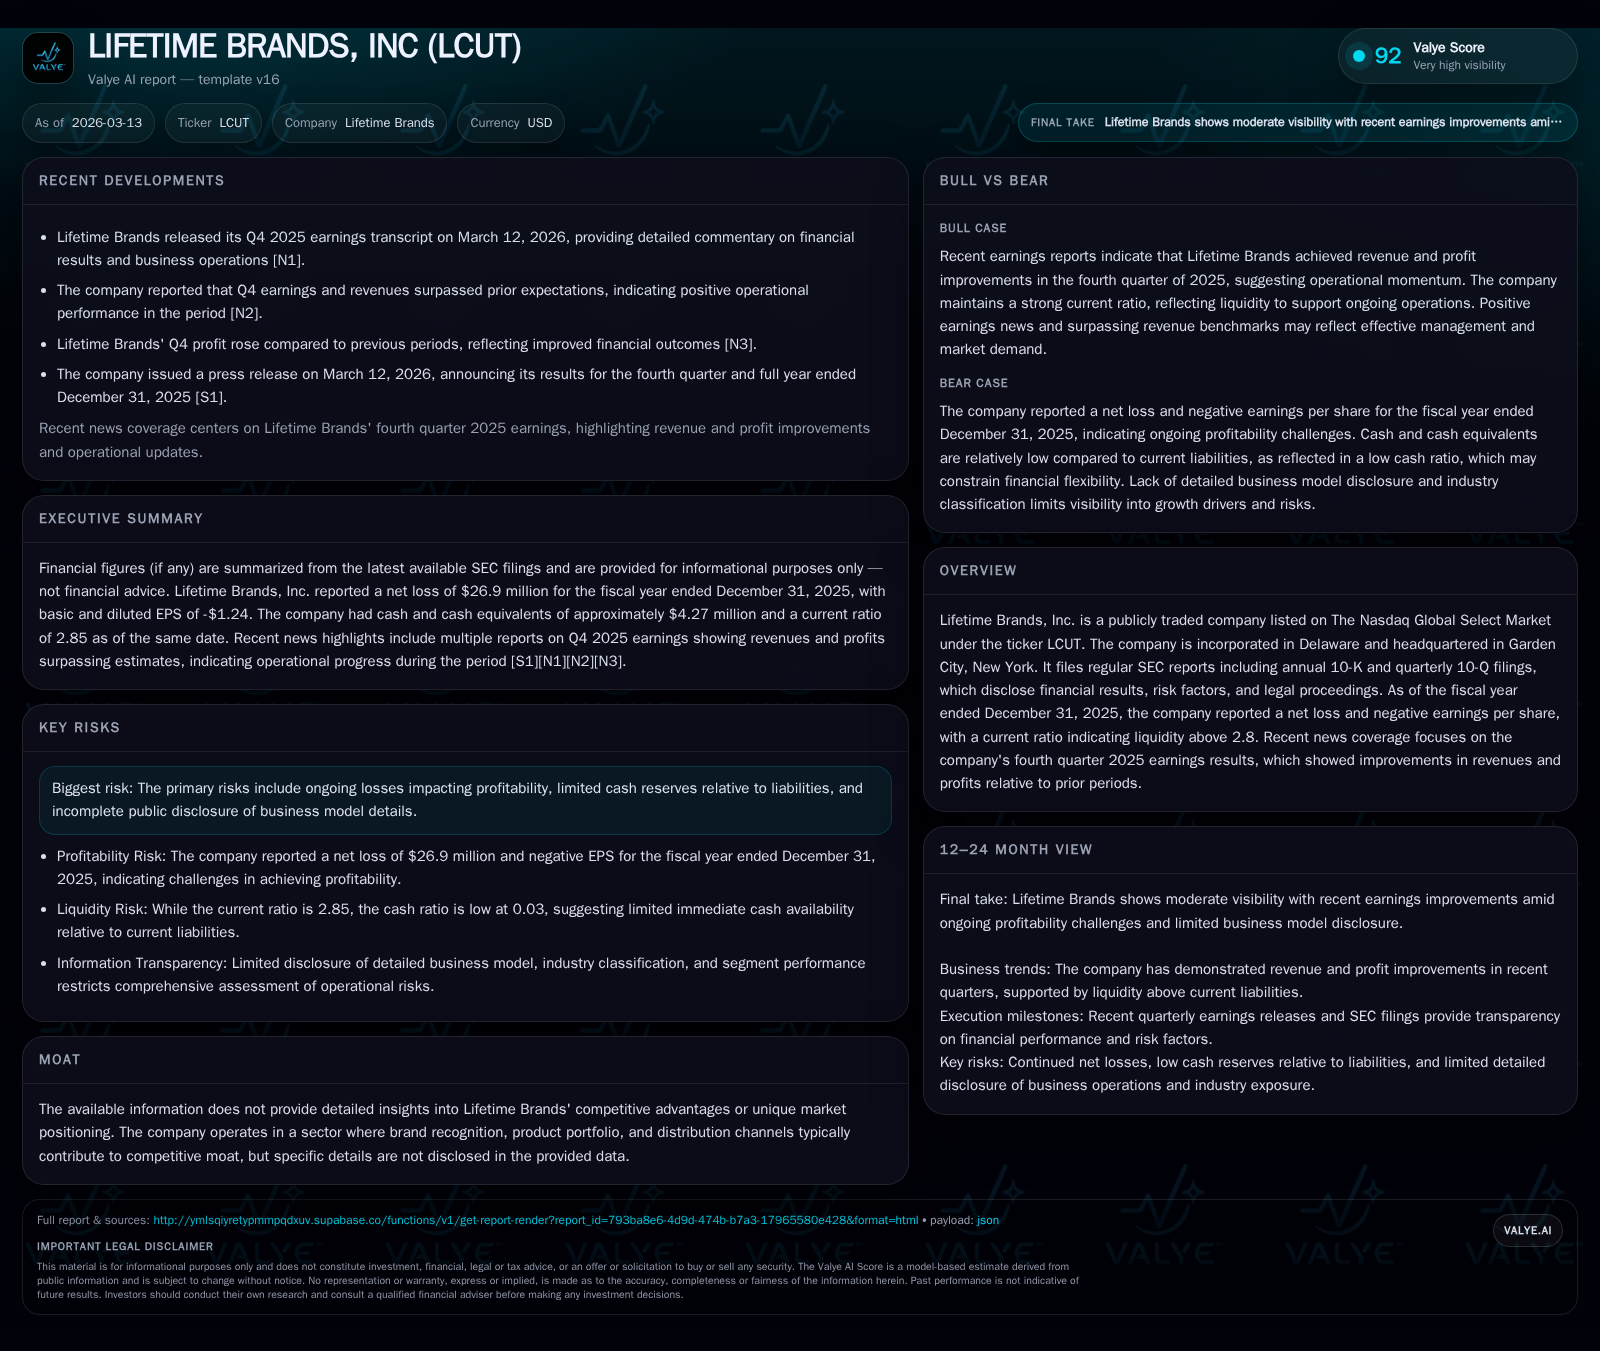
Lifetime Brands reported a modest revenue decline in 2025 yet continued to incur operating and net losses for the full year. Despite this, the company's liquidity position remains solid with a current ratio near 2.85 and positive operating cash flow. Dividend payments have persisted, though capital expenditures have nearly doubled, indicating measured reinvestment. Legal and regulatory risks cast uncertainty on near-term outlook while management signals cautious optimism. Key performance indicators like margin trends and cash flow will be critical to monitor as Lifetime attempts to translate top-line stability into sustainable profitability.
Recent Earnings Beat: Revenue Strength vs. Profit Pressures
Lifetime Brands’ fourth-quarter results for 2025 surprised positively on the top line, outpacing revenue expectations despite persistent profitability headwinds [N1, N2, N12]. The company’s ability to sustain revenues suggests some operational resilience within its core product categories amid broader market uncertainties. However, the bottom line remains challenged: operating losses were reported for the full year, indicating margin pressures and cost absorption issues remain formidable.
Given Lifetime Brands operates in consumer product segments where distribution efficiency and cost control directly impact margins, sustaining top-line momentum alone may not suffice to restore earnings profitability soon without structural improvements [S1].
Revenue and Profit Trends Over Time: Unpacking the Shifts
An examination of available financials reveals a historically stable revenue base around $579 million (noting latest available data point is for 2017) but increasingly squeezed profitability metrics more recently [F1]. Operating income fell dramatically from a positive $27 million in FY2024 to a loss of $9.4 million in FY2025, an approximately 135% decline year-over-year. Net income followed suit, with losses widening to nearly $27 million after consecutive annual deficits at lower levels.
These patterns indicate deteriorating operational leverage amid either rising costs or pricing pressures over recent periods. The stable revenue figures combined with declining profit margins suggest issues such as increased SG&A expenses or supply chain inflation may be impinging on Earnings Before Interest and Taxes (EBIT) metrics.
Historical performance (annual)
| FY | Net ($mm) | CFO ($mm) | OpInc ($mm) | Capex ($mm) | Net YoY |
|---|---|---|---|---|---|
| 2025 | -27 | 8 | -9 | 4 | -77.6% |
| 2024 | -15 | 19 | 27 | 2 | -80.3% |
| 2023 | -8 | 56 | 32 | 3 | -36.4% |
| 2022 | -6 | 24 | 24 | 3 |
Source: SEC companyfacts cache [F1].
Capital returns and efficiency (annual)
| FY | Div ($mm) | Buybacks ($mm) | FCF ($mm) |
|---|---|---|---|
| 2025 | 4 | 0 | 3 |
| 2024 | 4 | 0 | 16 |
| 2023 | 4 | 3 | 54 |
| 2022 | 4 | 6 | 21 |
Source: SEC companyfacts cache [F1].
Note: Latest revenue data available is from prior years; '–' indicates data not available for respective years.
The Weight of Operating Losses and Their Drivers
The expansion of operating losses from a positive base reflects possibly entrenched structural cost challenges such as higher SG&A ratios or inefficiencies related to product mix shifts [S1]. Disclosure documents note no significant moat or distinctive competitive advantage, highlighting vulnerability to external pricing pressures and cost inflation while lacking unique market insulation [S1].
Company responses during earnings calls reference efforts to optimize supply chain operations but stop short of quantifying expected margin recovery timelines [N1]. Such conditions typify mature consumer goods companies facing input cost volatility without clear pricing power enhancements.
Liquidity Position and Balance Sheet Resilience Amid Losses
Despite ongoing losses, Lifetime Brands maintains a robust liquidity cushion supported by current assets of approximately $374 million against current liabilities near $131 million, yielding a strong current ratio of about 2.85 as of year-end 2025 [F1]. The cash balance stands at roughly $4.3 million.
Liquidity reports over the past year confirm no material covenant breaches or financing distress [S10], [S12], [S16]. Working capital management appears effective enough to sustain operations through cyclical weakness or strategic investment phases without immediate solvency concerns.
Capital Allocation: Dividends, Share Repurchases, and Cash Flow Realities
Lifetime Brands continues returning capital via dividends paid at around $3.78 million annually even amid unprofitable results [F1], underscoring commitment to shareholder distributions despite constrained free cash flow (estimated at roughly $3.25 million after capex).
Notably, share repurchase activity ceased in recent fiscal years aligning with prudent capital preservation amid profitability recovery uncertainties [F1], [S11], [S14]. Operating cash flow has declined sharply to about $7.6 million but remains positive—allowing minimal reinvestment alongside returns.
Risk Factors: Litigation and Market Headwinds From SEC Disclosures
Recent filings emphasize ongoing legal proceedings that represent contingent liabilities posing potential financial burdens over time [S4], [S6]. These risks compound general exposure typical for branded consumer goods firms operating under regulatory scrutiny and competitive pressure.
Disclosure also underscores absence of detailed moat narrative reflecting potential vulnerability to market share erosion and margin compression from aggressive competitors or disrupted retail environments.
Future Growth Prospects: Management Commentary and Analyst Expectations
Management commentary during Q4 earnings highlighted cautious optimism anchored on operational initiatives aimed at expense control coupled with selective growth investments [N1]. Meanwhile, analyst previews suggest prospects for continued modest beats on revenue driven by product innovation or expanded distribution networks [N5].
However, conversion of these top-line gains into meaningful profit recovery remains unsettled absent clear margin restoration guidance.
Key Metrics to Monitor: What Will Define Lifetime Brands’ Trajectory
In absence of formal forecasts, monitoring certain KPIs will be essential:
- EBITDA trajectory as a proxy for core operating profitability excluding non-recurring items;
- Gross margin percentages tracking cost absorption effectiveness;
- Operating cash flow shifts revealing real liquidity dynamics;
- Inventory turns indicating supply chain efficiency;
- SG&A expense ratios relative to sales signaling cost discipline.
Together these will offer clearer insights into whether Lifetime Brands can translate steady revenues into sustainable earnings gains or continue fluctuating amid operational headwinds.
This analysis is based exclusively on publicly available data as referenced without offering investment recommendations or price targets.
Disclaimer: This is research-only, informational analysis and not investment advice. It may include AI-generated interpretation and general industry context. Always verify important details using primary sources.
Comments