
Chemung Financial Corp Strengthens Capital Structure Amid Loan Portfolio Growth and Strategic Balance Sheet Repositioning
The company’s 2025 performance reveals a recalibration of liquidity, capital, and credit loss allowances balancing growth with risk management.
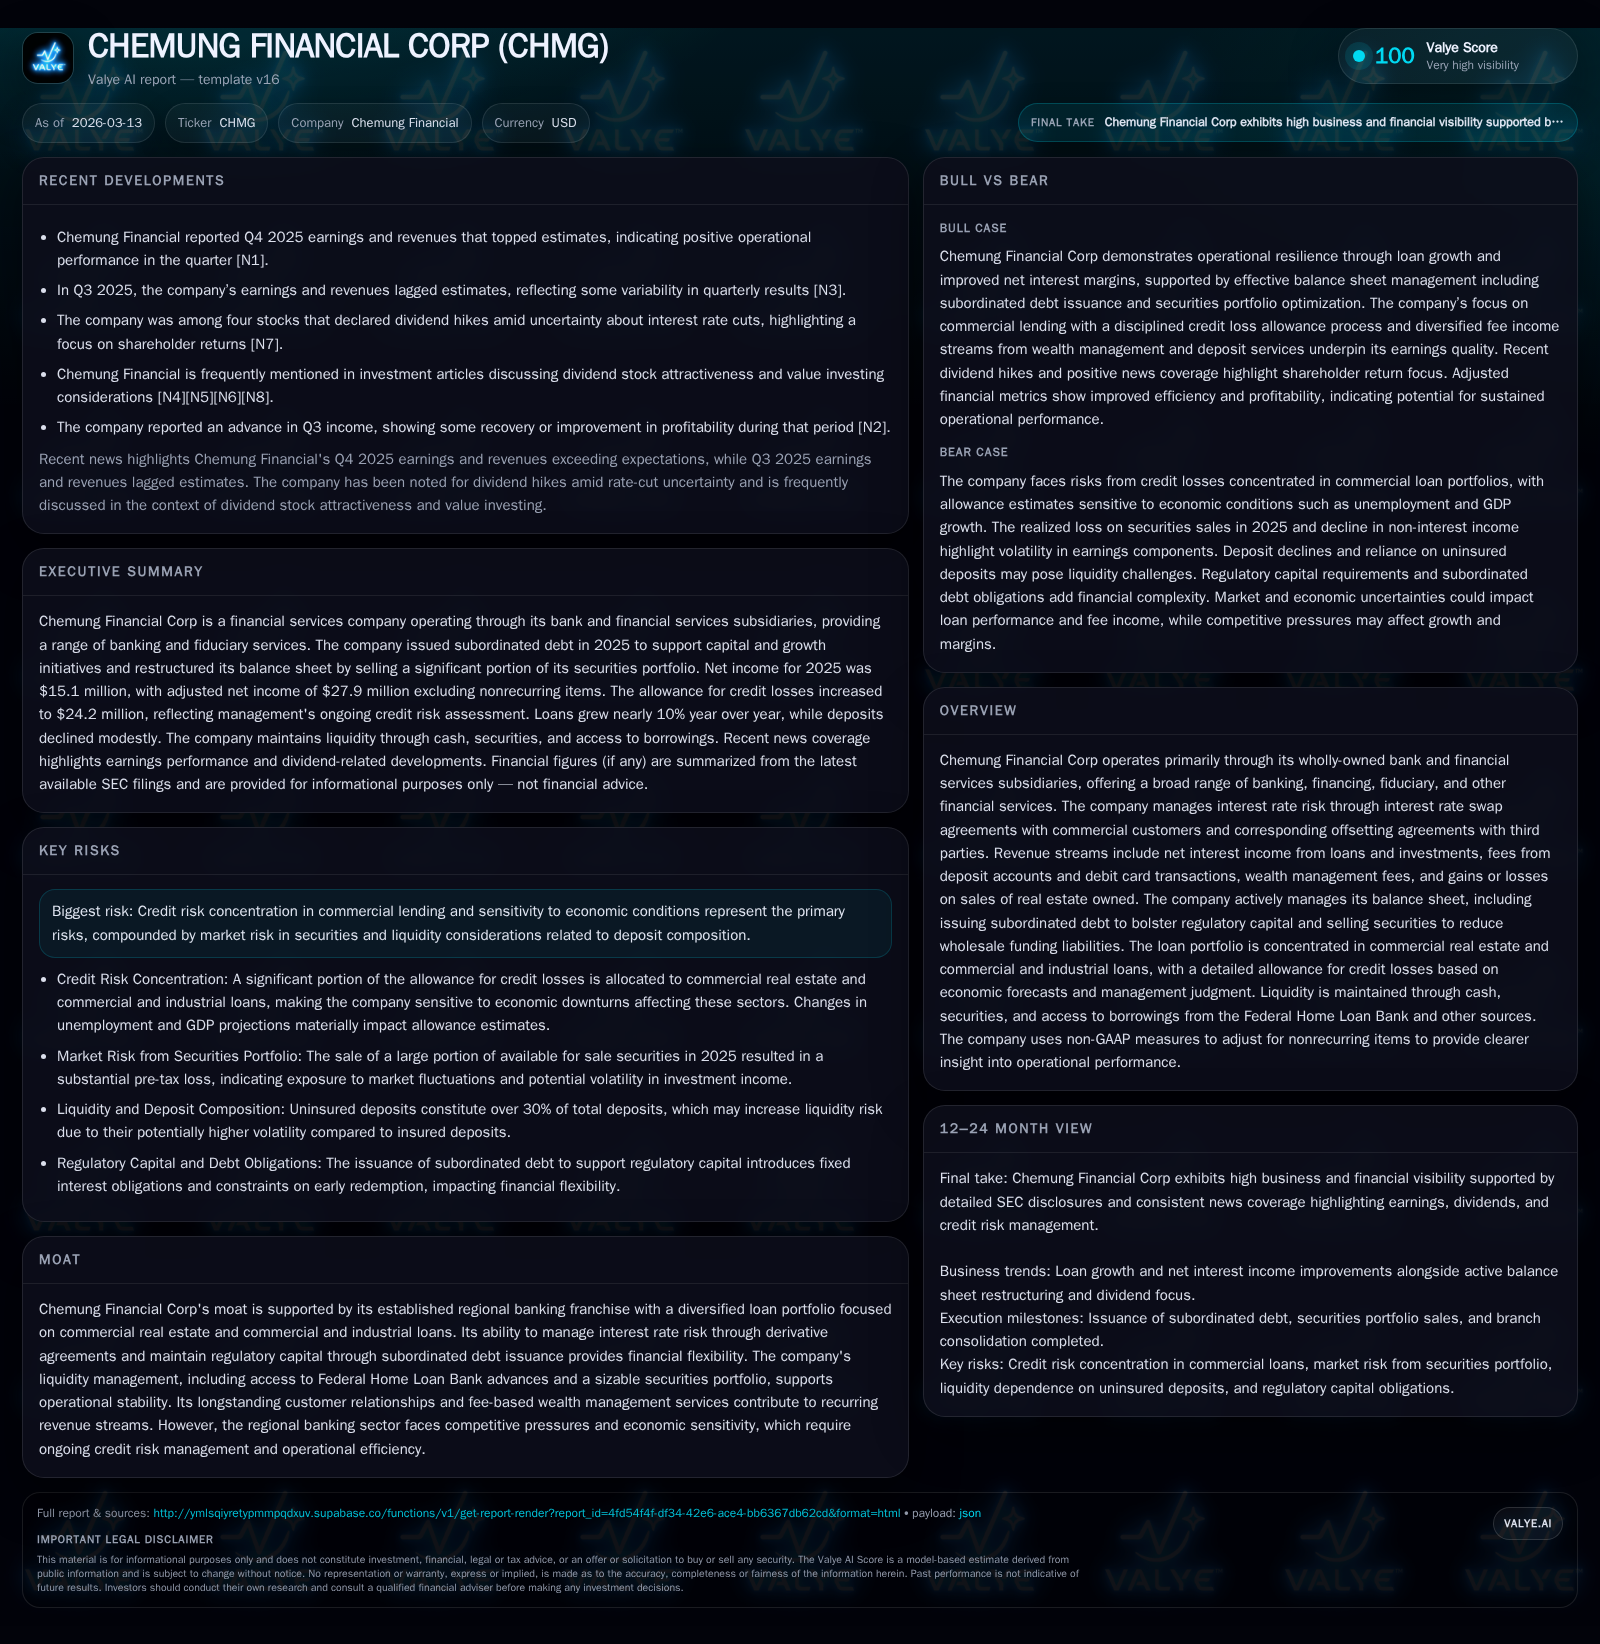
Chemung Financial Corp demonstrated a mixed 2025 financial profile characterized by higher loan book expansion alongside strategic balance sheet maneuvers. Despite a notable net income decline driven partly by realized losses on securities sales, operating cash flow surged impressively. The firm’s issuance of subordinated debt enhanced regulatory capital, providing flexibility for future commercial real estate lending in key markets. Liquidity improved through sizable securities sales and wholesale funding payoffs, yet credit risk remains concentrated in commercial loans amid a cautious economic outlook.
Overview of Historical Performance
Chemung Financial Corporation operates through its wholly owned subsidiaries mainly focused on banking and related financial services, maintaining a strong regional franchise with loan concentrations in commercial real estate (CRE) and commercial & industrial (C&I) loans [S1]. Its revenue stems primarily from net interest income on loans and investments coupled with fees from deposit accounts and wealth management services.
In fiscal year (FY) 2025, Chemung reported net income of $15.1 million, a significant decline of over one-third compared with $23.7 million in FY 2024 [F1]. This reduction was materially affected by the recognition of a pre-tax loss totaling approximately $17.5 million related to strategic sales that eliminated roughly 40% of its available-for-sale (AFS) securities portfolio primarily consisting of U.S. Treasury, SBA-pooled loans, mortgage-backed securities (MBS), and municipal bonds [S1]. The deep pullback in securities reflected management’s effort to reduce reliance on wholesale funding sources.
Meanwhile, operating cash flow showed a robust improvement to approximately $45.5 million—a year-over-year increase of about 53%. This reflects strong cash earnings adjusted for non-cash charges inherent in the balance sheet repositioning program [F1][S6]. Capital expenditures contracted sharply compared to prior years as spending normalized following prior investments.
Historical performance (annual)
| FY | Net ($mm) | CFO ($mm) | Capex ($mm) | Net YoY |
|---|---|---|---|---|
| 2025 | 15 | 45 | 2 | -36.2% |
| 2024 | 24 | 30 | 4 | -5.3% |
| 2023 | 25 | 31 | 0 | -13.1% |
| 2022 | 29 | 35 | 0 |
Source: SEC companyfacts cache [F1].
Capital returns and efficiency (annual)
| FY | Div ($mm) | Buybacks ($) | FCF ($mm) |
|---|---|---|---|
| 2025 | 6 | 396000 | 44 |
| 2024 | 7 | 344000 | 26 |
| 2023 | 6 | 316000 | 30 |
| 2022 | 6 | 933000 | 35 |
Source: SEC companyfacts cache [F1].
Note: Operating cash flow is CFO; Buybacks are stock repurchases.
Loan Portfolio Growth and Credit Risk
Chemung's loan portfolio expanded by nearly 10% during 2025, rising from roughly $2.07 billion to $2.27 billion [F1][S11]. This was driven predominantly by increases in CRE mortgages, both owner-occupied and non-owner occupied, alongside steady growth in C&I loans—reflecting the Company’s strategy to target commercial sectors within its regional footprint.
The loan growth coincided with an increase in the allowance for credit losses by approximately 13%, reaching $24.2 million at year-end [F1]. Management applies a CECL model which incorporates observed historical trends combined with reasonable and supportable economic forecasts; key inputs revised during early-2025 included updated baseline loss rates and slower prepayment speeds amid economic uncertainties [S19]. Deterioration in macroeconomic forecasts including unemployment was offset partially by improved internal portfolio metrics.
Concentration remains principally aligned with CRE and C&I categories, reflecting sectoral risks especially sensitive to economic cycles including interest rates and local market dynamics.
Balance Sheet Repositioning and Capital Structure Enhancements
A defining feature of Chemung's recent activity was its strategic balance sheet repositioning during FY2025 aimed at improving capital adequacy and reducing wholesale funding dependence:
- In June 2025, Chemung issued ten-year subordinated notes totaling $45 million bearing initial fixed interest at 7.75%, converting after five years to floating tied to SOFR plus spread [S1][S14].
- From these proceeds, $37 million was downstreamed as common equity Tier 1 capital at the bank subsidiary level enhancing overall regulatory capital buffers [S1][S5].
- Concurrently, the firm sold approximately $245 million book value of AFS securities realizing a pre-tax loss (~7%) but generating over $227 million cash proceeds used chiefly to retire $155 million existing wholesale funding comprising brokered deposits and Federal Home Loan Bank (FHLB) advances without early penalties [S1][S6].
This strategic refinancing lowered the cost structure associated with short-term borrowing while fortifying capital ratios permitting future organic loan growth especially within CRE concentration limits.
Liquidity profiles strengthened as unsecured lines remained available totaling $65 million alongside access to FHLB overnight advances still utilized at around $87 million year-end under collateralized arrangements primarily against residential mortgage loans [S8][S9]. The elimination of brokered deposits entirely as of December further reduced systemic funding risks.
Deposits and Funding Sources
Total deposits saw moderate contraction (~5%) largely due to redemption or maturity runoff within time deposits and brokered monies which were strategically wound down during the year [S16]. Notably, uninsured deposits climbed slightly as a percentage of total deposits reaching just over 30%, including collateralized municipal deposits representing structured liquidity coverage mitigants [S8][S13].
The Company promotes stable core deposit gathering through multiple initiatives including linking loan origination tightly with customer primary checking accounts, ongoing marketing campaigns emphasizing convenience and product competitiveness, alongside payroll direct deposit focuses which follow well-established community bank playbooks [S9].
Dividend Policy and Capital Allocation
Chemung declared dividends aggregating approximately $6.3 million or $1.32 per share in FY2025 representing about a 41.88% payout ratio relative to net income compared with a lower payout ratio near 25% for FY2024 [F1][S4]. The elevated dividend payout relates substantially to earnings contraction influenced by non-cash losses from securities sales rather than operational performance deterioration.
Share repurchases continued cautiously under an authorized program approved since early 2021 aiming for up to roughly five percent of outstanding shares; actual repurchases during FY2025 amounted modestly to approximately $0.4 million spend at average costs near $40/share leaving residual buyback capacity intact [F1][S4].
Management signals intent to preserve internal capital generation aligned with prudent dividend stewardship while retaining optionality for opportunistic share repurchases depending on liquidity availability.
Wealth Management Segment Contributions
Assets under management or administration (AUM/AUA) within Chemung’s Wealth Management Group increased moderately by approximately six percent reaching over $2.3 billion ending December 31, 2025 reflecting positive market appreciation as well as net inflows excluding internally held assets [S16]. These fee-based revenue streams contribute stability outside core lending interest margins supporting recurring income diversification.
Forward-Looking Considerations
Absent explicit forward guidance disclosures within SEC filings or news releases, stakeholders should monitor:
- Trajectory for loan growth particularly CRE concentration ratios given regulatory scrutiny toward sectoral risk exposures;
- Movements in allowance for credit losses metrics tied closely to regional economic factors such as unemployment trends and GDP forecasts;
- Potential further repositioning within investment securities portfolios responding dynamically to interest rate cycles;
- Capital adequacy measurements post-subordinated debt amortization phases beginning circa mid-decade regarding Tier capital impact;
- Deposit mix evolution especially uninsured versus brokered composition influencing liquidity risk profiles;
- Dividend policies balancing income distribution against retained capital needs amid profit volatility;
- Market conditions affecting wealth management AUM levels underpinning fee-based revenues.
Risk Factors Summary
Credit risk concentration remains foremost given the focus on commercial real estate lending sensitive to cyclical economic headwinds including possible regional market contractions or borrower stress scenarios causing elevated charge-offs beyond modeled assumptions [S17]. Exposure also exists related to potential market value depreciation within investment-grade securities portfolios influenced by interest rate volatility impacting unrealized losses despite low default expectations.
Liquidity considerations relate closely to deposit composition changes where brokered deposit eliminating strategies introduce shifting dynamics toward more stable core funding but require active monitoring given uninsured deposit levels above typical community banking norms.
Interest rate risk management is supported materially via derivative hedging agreements; however this also introduces counterparty and basis risks warranting ongoing governance attention [S12].
Conclusion
Chemung Financial Corp’s recent financial results reflect deliberate strategic recalibration emphasizing capital strength improvement through subordinated debt issuance combined with liquidity enhancement by selling nearly half its securities portfolio while retiring more costly wholesale funding lines. Loan portfolio expansion notably within CRE supports future earnings opportunities though accompanied by increased credit loss provisions reflecting heightened caution under current macroeconomic conditions. The company demonstrates disciplined capital allocation balancing dividend increases even amid earnings pressure while retaining share repurchase optionality conservatively. Going forward, monitoring asset quality trends alongside evolving balance sheet composition will be critical signals indicative of Chemung’s ability navigate regional banking pressures leveraging its longstanding community franchise advantages.
This analysis is based solely on publicly filed SEC documents dated up through March 13, 2026 ([F1], [S#]) without speculative forecasts or investment recommendations.
Disclaimer: This is research-only, informational analysis and not investment advice. It may include AI-generated interpretation and general industry context. Always verify important details using primary sources.
Comments