
Tidewater’s Growth Rebounds With Strategic Fleet Expansion and Geographic Diversification
Tidewater leverages its diversified offshore vessel fleet, global footprint, and acquisitions to drive robust earnings recovery amid offshore market cycles.
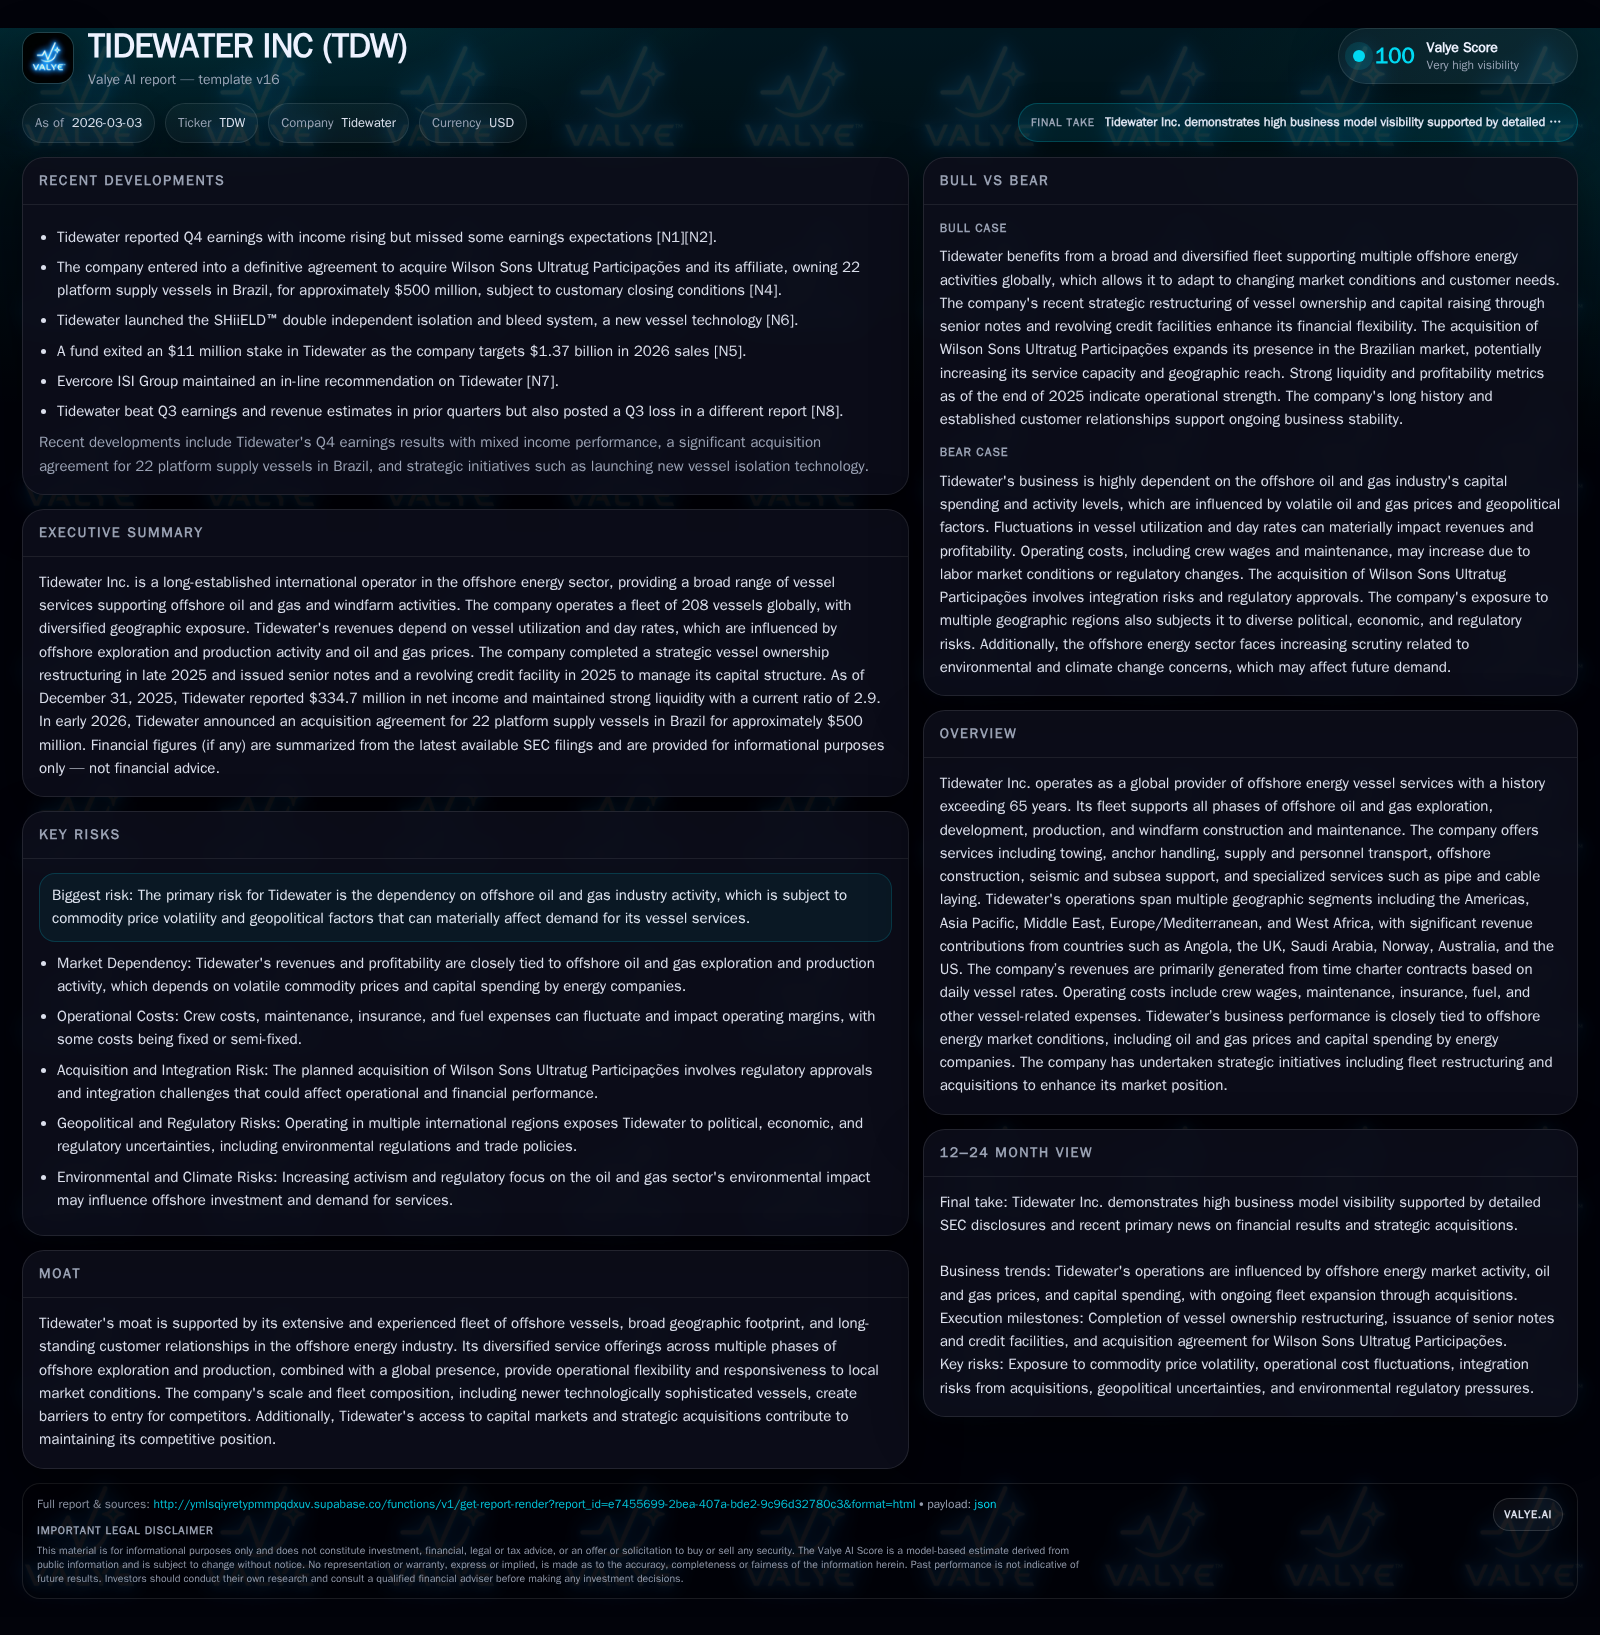
Tidewater Inc., a longstanding provider of offshore energy vessel services, has emerged from a pronounced industry downturn with a strong rebound in revenue and profitability fueled by strategic fleet additions and geographic diversification. The company’s 2025 financials show a 7.7% revenue increase and an outsized 85.2% jump in net income, supported by operational improvements across key global segments such as Angola, Saudi Arabia, and the UK. Tidewater’s recent $500 million acquisition of Wilson Sons Ultratug expands presence in Latin America and strengthens its competitive moat built on technologically advanced vessels under time charter contracts. While dependency on volatility-prone offshore oil markets remains a risk, disciplined capital allocation including meaningful share repurchases alongside sustained free cash flow generation underpin Tidewater’s operational resilience.
Rebounding Growth Amid Offshore Market Cycles
Tidewater's financial performance over recent years illustrates the cyclical nature of the offshore energy services sector influenced heavily by upstream capital spending trends tied to oil prices. Revenue declined sharply through the pandemic period but showed clear recovery momentum starting in 2023. By FY2025 revenues reached $1.35 billion representing a 7.7% increase over the prior year [F1]. Operating income advanced to approximately $283 million despite a slight year-over-year dip (-9.2%), linked partly to increased operating expenses amid higher activity levels [F1]. The most dramatic change was net income which soared by 85.2% to roughly $335 million driven by improved operational leverage and cost control [F1]. Operating cash flows rose sharply by over 38%, reaching about $379 million; this robust cash generation funded modest capex of around $25.8 million focused mainly on fleet upkeep rather than expansion [F1].
Historical performance (annual)
| FY | Net ($mm) | CFO ($mm) | OpInc ($mm) | Capex ($mm) | Net YoY |
|---|---|---|---|---|---|
| 2025 | 335 | 379 | 283 | 26 | +85.2% |
| 2024 | 181 | 274 | 311 | 28 | +85.9% |
| 2023 | 97 | 105 | 182 | 32 | +546.8% |
| 2022 | -22 | 40 | 27 | 17 |
Source: SEC companyfacts cache [F1].
Capital returns and efficiency (annual)
| FY | Buybacks ($mm) | FCF ($mm) | ROE% |
|---|---|---|---|
| 2025 | 90 | 353 | 24.5 |
| 2024 | 91 | 246 | 16.2 |
| 2023 | 35 | 73 | 9.4 |
| 2022 | 24 | -2.5 |
Source: SEC companyfacts cache [F1].
*Note: FY2024-25 values from segment disclosures [S4], [S5] reconciled with financial highlights [F1]. Companies occasionally revise figures post-initial release.
The revenue recovery is attributable to resumed offshore work programs reflecting stabilized mid-to-long term oil prices critical for client investment confidence , reinforced further by extensions or new awards of time charter contracts often spanning multiple months or years providing revenue visibility.
Fleet Composition and Service Diversification: Tidewater’s Moat
Tidewater operates one of the most comprehensive fleets globally supporting diverse facets of offshore energy sector needs — from oil and gas exploration through windfarm construction/maintenance . Its vessels include anchor handling tug supply (AHTS) boats, platform supply vessels (PSVs), crew boats for personnel transport, seismic support vessels, pipe laying crafts, cable laying units, and specialized subsea service ships [S1],[S4]. This broad fleet composition enables servicing multiple phases of exploration, development, production and decommissioning activities.
The reliance on time charter contracts forms the backbone for predictable daily vessel rates billed generally irrespective of voyage length but correlated with operational availability — a stable revenue model allowing scheduling optimization across geographies benefiting from technological sophistication enhancements introducing newer vessels equipped with more efficient propulsion systems and dynamic positioning capabilities crucial for complex subsea tasks ,[S4].
Fleet renewal remains incremental; recent years saw delivery of ten new vessels financed partly through EUR ~24.9 million facility agreements at low fixed interest rates signaling measured capital allocation prioritizing quality over volume expansions [S12]. Maintenance and regulatory recertification add ongoing operating cost components amortized over roughly thirty-month periods after drydock activities ensuring compliance without excessive capex spikes.
Increased crew wage pressures emerge from scarcity of qualified marine personnel skilled in dynamic positioning technology necessitated by advanced fleets; repair & maintenance costs rise commensurately with fleet size and vintage but offset partially by insurance premiums weighted against safety records [S26],.
Geographic Footprint Driving Revenue Spread
Tidewater's operational diversity spans five key segments led by dedicated management teams overseen centrally enabling resource deployment tailored to local market characteristics including regulatory regimes and labor conditions [S4]. The Americas segment including U.S., Mexico, Brazil posted improving vessel revenues approximately $270 million in FY2025 while Europe/Mediterranean generated substantial contributions anchored primarily by UK/Norway operations near $266 million combined [S4],[S5]. Middle East revenues from Saudi Arabia outpaced prior years nearing $134 million thanks to buoyant offshore development spend.
West Africa's Angola remained stable at nearly $156 million reflecting continued deepwater exploration investment despite global volatility whereas Australia’s contribution contracted modestly tied to lumpy project scheduling [S5]. This geographic spread mitigates single-market concentration risks which remain contained despite some customer clients accounting for over 10% revenues each yet diversified sufficiently across more than three dozen countries overall [S4], enhancing resilience amid regional oil price fluctuations or geopolitical disturbances impacting local demand.
Recent Strategic Acquisition: Wilson Sons Ultratug Deal
On February 23, 2026 Tidewater announced definitive agreement to acquire Wilson Sons Ultratug Participações S.A., owning a fleet of twenty-two platform supply vessels principally operating within Brazil’s prolific offshore basins for approximately $500 million enterprise value net of assumed debt around $261 million [N3],[S10]. This transaction marks a tactical geographical fleet expansion reinforcing Tidewater's position in Latin America's strategically vital energy sector corridor.
By integrating these additional assets under its operational umbrella slated for late Q2 closing subject to regulatory approvals including Brazilian Antitrust Authority consents plus lender permissions on debt assignments, Tidewater expects enhanced towing capability alongside augmenting its diverse service offerings amid ongoing offshore demand volatility accentuated by macroeconomic uncertainties.
This move aligns with management's stated growth strategy emphasizing targeted acquisitions driving scale while complementing organic fleet rejuvenation efforts financed prudently rather than aggressive capacity additions risking oversupply pressures [S15],.
Financial Highlights: Revenue, Earnings, and Operating Cash Flows
FY2025 results affirm Tidewater's operational momentum post-pandemic industry contraction:
- Revenue increased modestly by +7.7% vs FY24 reaching approximately $1.35 billion portraying stabilization amidst shifting macro conditions [F1],[S4].
- Operating income declined slightly -9.2% due mainly to cost inflationary headwinds including crew wages & fuel offsetting volume-related gains totaling ~$283 million [F1].[N4]
- Net income surged an outsized +85% exceeding prior year at close to $335 million assisted by lower taxes or non-operating gains contributing to profitability uplift [F1].[N4]
- Strong operating cash flow generation increased over +38% reaching near $379 million enabling healthy funding for capex requirements concentrated at ~$26 million conservative relative to free cash flow capacity enhancing liquidity buffers [F1].[N4]
- Quarter-end cash & equivalents stood at around $579 million underscoring comfortable liquidity even considering withheld receivables collected late Q4 improving balance sheet quality [F1],[S15],[N1].
- Capex reduction YoY (-6%) mirrors sustained asset life extensions avoiding overcapacity while Fleet Facility Agreements underpin financing structure supporting these investments cheaply at sub-3% effective rates fixed for installments initiating six months post-vessel delivery [S12].
- Share repurchase programs resulted in retirement of over two million shares representing near $90 million expenditure sustaining shareholder return emphasis despite absence of dividend payments outlined historically albeit infrequently executed until mid-2010s [F1],[S21],[S28].
Capital Allocation: Investments, Dividends, and Share Repurchases
Tidewater maintains balanced capital discipline maintaining focus on fleet maintenance capex while opportunistically returning capital via share repurchases demonstrating efficient equity utilization evidenced by ROE approximating 24.5% calculated as FY25 net income divided by FY25 equity near $1.37 billion reinforcing returns favorable versus many industry peers hampered by cyclicality challenges [F1].
Liquidity profile bolstered by newly issued senior unsecured notes aggregating $650 million at fixed coupon near ~9% maturing July 2030 combined with a fresh revolver facility totaling $250 million widens borrowing confidence supporting both organic operations plus integration financing for acquisitions like Wilson Sons Ultratug Participações expected before mid-2026 closing dates subject to customary closing conditions including approvals detailed in filings [S10],[S12],[N3].
No regular dividends have been declared recently; Tidewater prioritizes debt management flexibility alongside buybacks designed to enhance per-share metrics when valuations evidence opportunity aligning with board authorizations exceeding initial $90-million limit approved early-2025 expanded further later that year reflecting confidence in cash flow sufficiency amidst fluctuating industry cycles [F1],[S21],[S28].
Risk Factors: Oil Price Volatility and Geopolitical Exposures
The primary inherent risk resides in reliance on offshore oil & gas sector activity inherently tied to volatile global commodity pricing influenced additionally by geopolitical events impacting demand-supply equilibrium unpredictably.,[S2] Such factors cause upstream capital budget swings potentially affecting utilization rates or day-rate realizations despite mitigating elements like longer-term time charter contracts securing baseline rate floors minimizing exposure short-term spot fluctuations.
Additional disclaimers relate to foreign exchange fluctuations given multinational fee structures versus operating cost currencies partially addressed through dollar-denominated contracting but residual currency mismatches persist influencing earnings volatility slightly.[S22],[S26]
Moreover adverse governmental policy changes or sanctions impacting key geographical operating regions particularly Middle East or West Africa add uncertainty requiring continuous monitoring. Management acknowledges these as principal contingencies with mitigation efforts via geographic diversification plus fleet flexibility but cannot entirely hedge downside risk amid sector shocks universally impacting industry participants.[S18],[S26]
Outlook and Key Milestones to Monitor
Absent explicit forward revenue or earnings guidance recent disclosures direct focus toward several pivotal forthcoming developments shaping near-term outlook:
- Integration progress post-Wilson Sons Ultratug acquisition including synergy realization timelines will influence Latin American segment contribution uplift.[N3]
- Contract renewals across key geographic segments notably Angola/UK/Saudi Arabia remain essential indicators impacting active utilization mix influencing overall vessel operating profit effectively translating into quarterly earnings variability.
- Any significant shifts in oil prices particularly sustained low levels near low-$60/barrel thresholds could trigger project delays tempering demand growth visibly observed previously.
- Monitoring quarterly operating statistics such as stacked vessel counts relative to active utilization provides real-time gauge of market tightness versus oversupply pressures common in cyclical environments.
- Capital market access stability ensures refinancing abilities critical amid evolving interest rates landscape notably impacting debt servicing cost structures post new bond issuances reducing refinancing risk compared with predecessor facilities.
Stakeholders should maintain vigilance over industry news flow contextualizing macroeconomic shifts aligned with company releases highlighting strategic execution velocity.
This report synthesizes publicly filed financial data combined with official corporate disclosures without projecting future results or providing investment recommendations.
Disclaimer: This is research-only, informational analysis and not investment advice. It may include AI-generated interpretation and general industry context. Always verify important details using primary sources.

Comments