
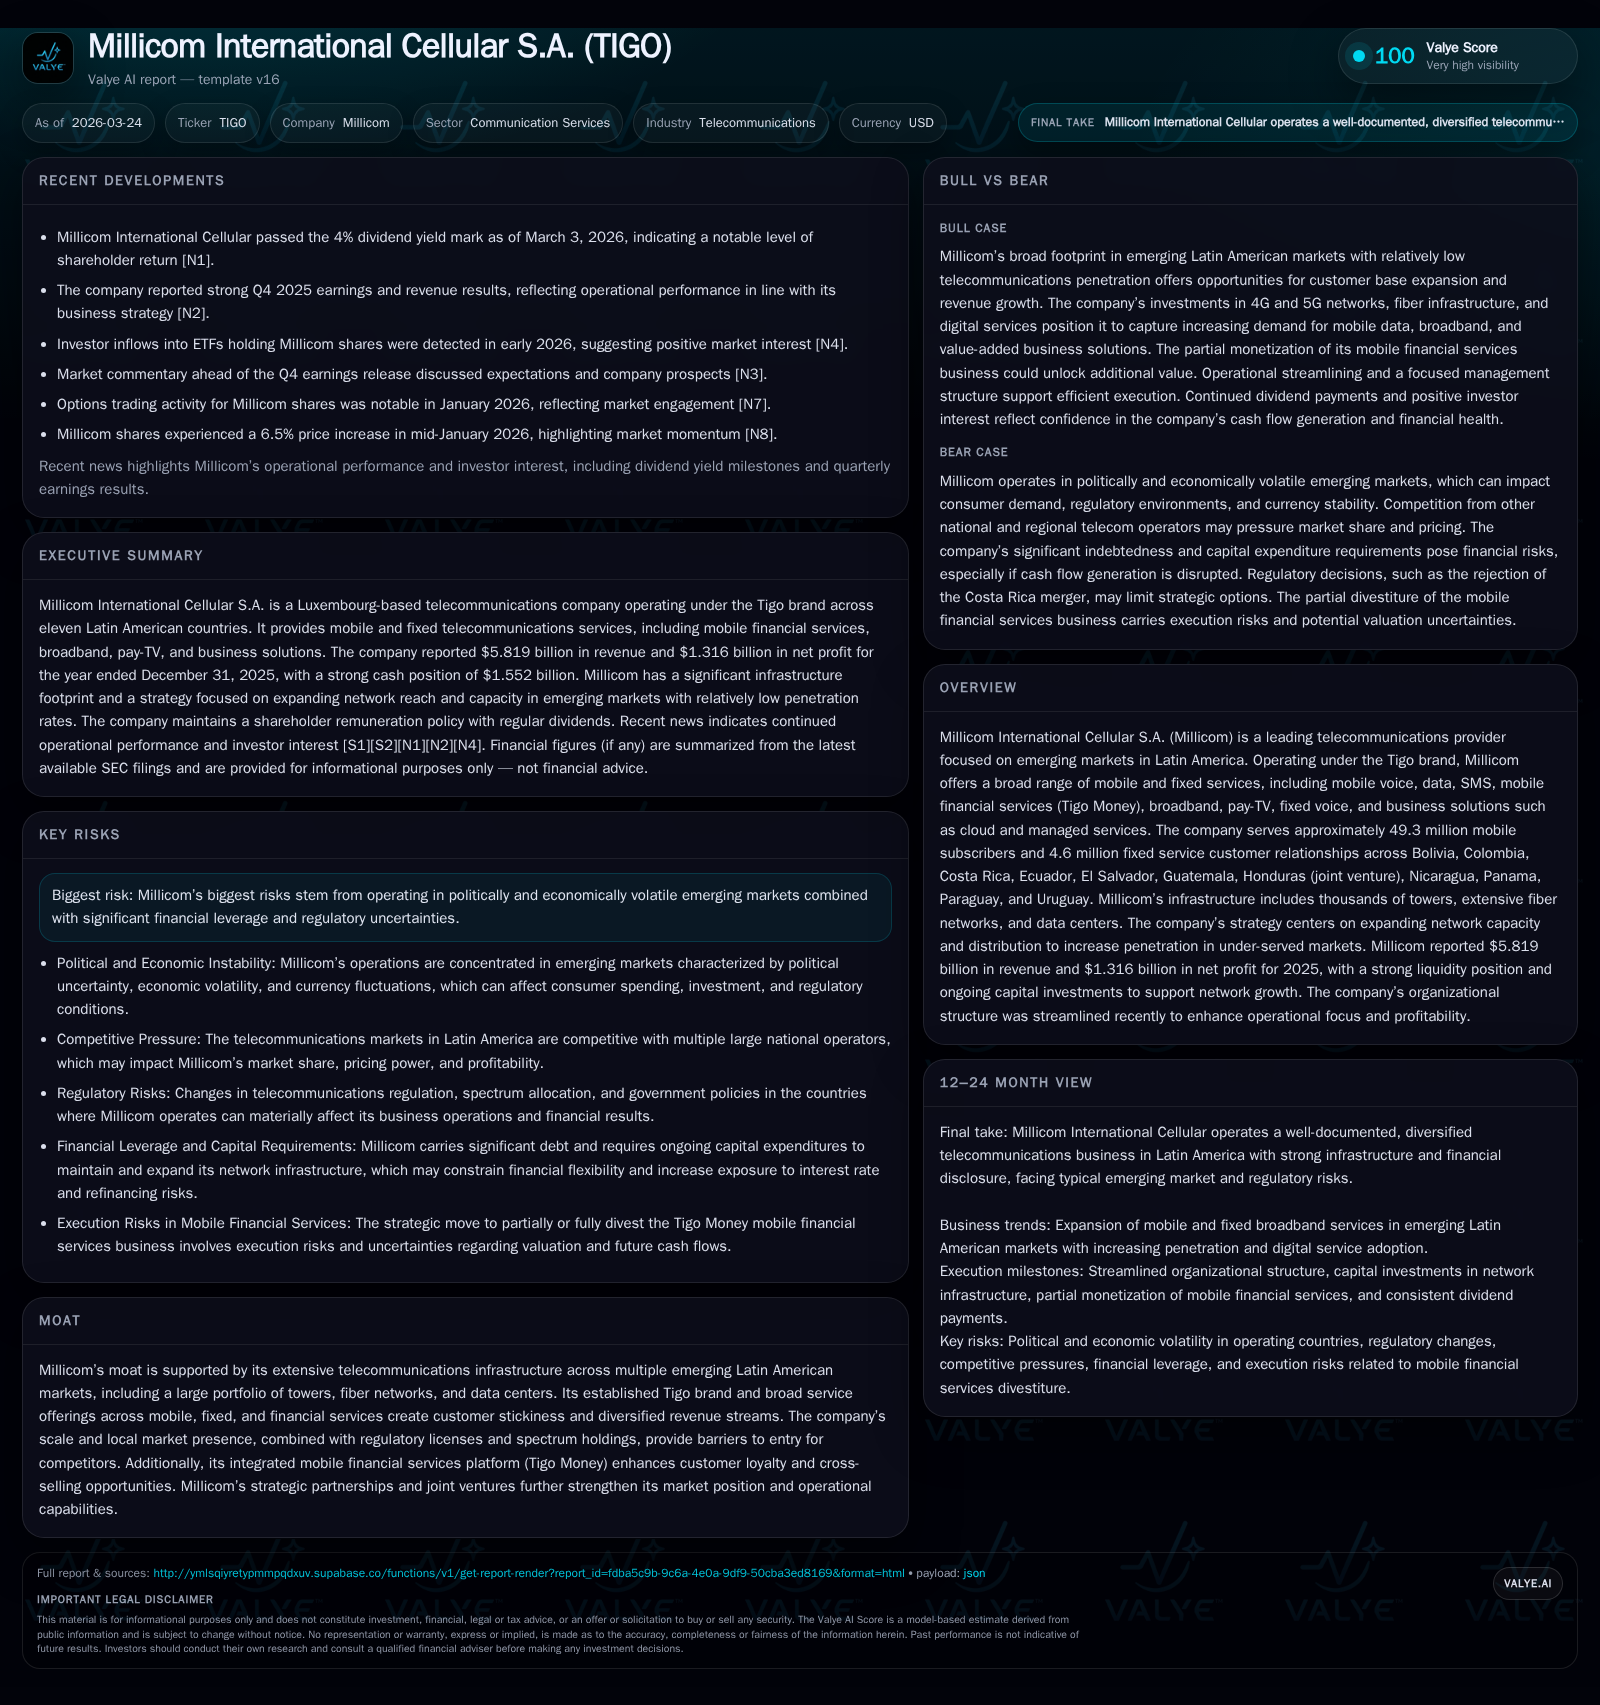
Millicom’s Resurgent Profitability and Strategic Expansion in Latin America
Millicom posts a striking profit turnaround in 2025 while deepening its Latin American footprint through joint ventures and infrastructure investments.
Millicom International Cellular S.A. (Tigo) delivered a remarkable net income recovery in fiscal year 2025 with a 408% increase despite only modest revenue growth of 0.3%, underscoring operational improvements and strategic gains from joint ventures. Its extensive presence across emerging Latin American markets, supported by mobile and fixed broadband services totaling over 49 million mobile subscribers, anchors its competitive position. Key strategic moves include a joint acquisition of Telefonica’s Chilean operations and continued network expansion amid regulatory challenges. Capital deployment shows a notable rise in dividends alongside prudent debt management, signaling Millicom's evolving business model integrating fixed-mobile convergence and financial services.
Millicom’s Historical Growth Trajectory: Revenue Stability Meets Profit Volatility
Millicom's financials for fiscal years ending December 31 reveal a pronounced divergence between revenue growth and profit generation. Over the period from 2023 to 2025, revenue edged up slightly from $5.66 billion to $5.82 billion, reflecting a modest compound annual growth rate punctuated by market maturity effects across Latin American territories. However, net income swung from a loss of $245 million in FY2023 to robust profits totaling $1.36 billion in FY2025—a more than fivefold improvement driven largely by operational improvements and asset monetization gains [F1].
Cost dynamics reflect upward pressure on depreciation ($961 million in FY2025 vs. $916 million prior year) consistent with ongoing capital-intensive network investments [S2]. Notably, amortization expenses held steady at $319 million year-over-year. Despite flat top-line trends (+0.3% YoY in FY2025), operating profit expanded substantially to $1.64 billion from $1.34 billion a year earlier.
Historical performance (annual)
| FY | Rev ($bn) | Net ($mm) | Rev YoY | Net YoY |
|---|---|---|---|---|
| 2025 | 5.8 | 1362 | +0.3% | +408.2% |
| 2024 | 5.8 | 268 | +2.5% | +209.4% |
| 2023 | 5.7 | -245 | -289.9% | |
| 2022 | 129 |
Source: SEC companyfacts cache [F1].
Capital returns and efficiency (annual)
| FY | Div ($mm) | ROE% |
|---|---|---|
| 2025 | 1050 | 37.6 |
| 2024 | 173 | 7.5 |
| 2023 | -7.1 | |
| 2022 | 3.5 |
Source: SEC companyfacts cache [F1].
Table summarizes available annual reported results; Capex is not fully disclosed annually.
Drivers Behind FY2025 Earnings Revival: Operational Efficiency and Joint Ventures
A crucial element underpinning Millicom's earnings resurgence was the enhanced contribution from its Honduras joint venture where it recorded a share of profit amounting to $102 million versus $54 million in the prior year [S2]. This JV accounts for significant subscriber scale—serving some 5 million mobile customers—and enjoys market leadership in both mobile and fixed broadband segments within Honduras [S1].
Complementing higher JV earnings was disciplined cost management that mitigated equipment-related direct costs despite elevated depreciation reflecting asset base expansion [S2]. The operating margin improved markedly to roughly 28%, propelled by operating profit increasing faster than top-line revenue.
Additionally, realized gains on partial divestitures—including tower transactions exceeding thousands of sites designated to SBA/Atis clients—materially supported profitability without undermining service capacity [S14]. This blend of organic operational improvements alongside strategic asset monetizations has fundamentally reshaped financial outcomes.
Geographic Footprint and Market Position: Focus on High-Value Latin American Markets
Millicom's footprint spans eleven key Latin American countries featuring diverse telecommunications landscapes:
- Honduras: Largest mobile provider with approximately 5 million subscribers; leading broadband provider with over 191,000 fixed broadband relationships; triple-play offerings including cable TV combined with DTH pay-TV extension into rural areas sustain customer reach.
- Nicaragua: Acquired leading mobile operator in 2019; serves roughly 3.8 million mobile subscribers; second largest broadband provider with growing cable footprint.
- Panama: Fully owned after buying out minority stakes; leads mobile segment with nearly 2.9 million users; dominant broadband operator through extensive HFC/FTTH networks.
- Paraguay: Market leader with about 4.4 million mobile customers and largest broadband subscriber base; strong content moat via exclusive national sports broadcasting rights through at least 2027 boosts customer loyalty.
- Uruguay: Bolstered by October 2025 acquisition of Telefónica Móviles de Uruguay (~1.1 million subs), expanding its B2B fixed internet portfolio.
Across these regions Millicom leverages hybrid fiber-coaxial (HFC), FTTH networks together with complementary fixed wireless access technologies to maintain service breadth [S1][S4]. Its integrated Tigo brand is recognized widely as an end-to-end digital services provider with capabilities spanning consumers through government sectors.
Strategic Moves: Recent Acquisitions and Partnerships Deepen Regional Presence
In early February 2026 Millicom announced a landmark joint acquisition of Telefonica’s Chilean telecom assets via a partnership vehicle shared with NJJ Capital owning respectively 49% and 51% stakes [S3]. This structure delivers strategic exposure without balance sheet consolidation or guaranteed financial obligations for Millicom.
The deal’s earn-out feature—up to an additional $150 million based on value creation metrics—aligns future price realization with performance yet limits downside risk upfront ($50 million initial payment). Importantly, there are well-defined options for stake swaps at discounts to prevailing trading multiples post Year five facilitating flexibility for both partners.
Such innovative transaction engineering reflects understanding of emerging market volatility while expanding geographic diversification into South America’s competitive landscape synergistically complementing existing holdings primarily clustered in Central America plus northern South America countries.
Forward-Looking Challenges and Opportunities: Regulatory Environment and Market Penetration
Operating predominantly in emerging Latin American countries exposes Millicom to considerable regulatory flux including periodic adjustments to mobile termination rates—a critical factor affecting interconnection fees—which have been subject to downward pressures imposed by governments aiming at consumer price moderation [S1][S5]. Variability across jurisdictions creates compliance costs as well as litigation risks notable especially within Colombia’s highly litigious business environment [S6].
Against this backdrop Millicom is actively expanding network coverage targeting under-served population segments where penetration—both mobile broadband adoption on smartphones (notably on LTE/4G networks)—and fixed broadband remain below global averages by material margins (typically mid-50% range or lower) creating room for subscriber additions over time [S4].
There are also ongoing initiatives around evolving ecosystem elements such as digital financial inclusion via Tigo Money—a rapidly growing platform extending critical services like payments, micro-loans, savings products to largely unbanked populations thus forging stickier customer ecosystems supportive of ARPU enhancement [S12].
Capital Allocation Priorities: Dividends, Debt, and Infrastructure Investment
Millicom notably increased its dividend payout sharply—from only $173 million paid out in FY2024 to over $1 billion for FY2025—reflecting stronger cash generation capacity amid earnings recovery [F1][S7][S22]. This dividend ramp underscores management confidence while rewarding shareholders amidst ongoing transformation.
Share buybacks authorized up to $150 million were also executed largely during the first half of FY2025 targeting accretive capital returns despite competing demands for funding aggressive infrastructure expansion projects supporting FTTH rollouts and mobile network upgrades including co-investments within its spectrum holdings portfolio [S9][S22].
Financial leverage remains substantial but controlled; total consolidated debt stood near $6.9 billion at year-end versus about $5.8 billion prior year excluding lease liabilities [F1][S16][S17][S21]. Refinancing efforts included selective repurchases of senior notes issued at attractive yields while preserving covenant compliance mainly focused at subsidiary operating levels allowing operational flexibility.
ROE improved impressively to approximately 37.6% measured against December-end equity of some $3.62 billion indicating efficient capital use following protracted earnings challenges [F1].
What to Watch Next: Metrics, Market Dynamics, and Potential Catalysts
As explicit financial guidance remains limited entering calendar year 2026 investors should focus on several key performance indicators:
- Subscriber growth trajectories particularly within newer markets such as Uruguay and Ecuador acquired recently;
- Mobile broadband penetration upticks correlating with sustained FTTH/HFC deployments impacting ARPU;
- Regulatory developments around interconnection fees or taxation reforms given historic fluctuations;
- Progression or finality around the anticipated partial divestiture or monetization pathways for Tigo Money enhancing capital recycling opportunities;
- Integration milestones relating to Telefonica Chile acquisition JV assessing strategic synergy capture;
- Evolving competitive landscape reactions including possible M&A activities among regional peers possibly impacting market shares or pricing dynamics.
Analyst upgrades noted recently may provide positive sentiment tailwinds yet intrinsic emerging market risks mandate close observation of geopolitical factors influencing macroeconomic outlooks [N2][N5].
Disclaimer: This report is prepared solely for informational purposes based on publicly available data as of March 24, 2026. It does not constitute investment advice or recommendations. All financial metrics are extracted strictly from verified SEC filings ([F1], [S#]) or cited news sources ([N#]). Readers should conduct their own due diligence considering inherent emerging market risks disclosed herein.
Disclaimer: This is research-only, informational analysis and not investment advice. It may include AI-generated interpretation and general industry context. Always verify important details using primary sources.
Comments