
Interface Inc Drives Growth with Sustainability and Portfolio Diversification
Integration of sustainable innovations, broadening product lines, and geographic mix shifts underpin Interface’s solid FY2025 results.
Interface Inc has demonstrated robust growth in FY2025, with operating income rising 22% and net income increasing 33.5%, driven by its evolving product portfolio that now includes luxury vinyl tile (LVT) and carbon negative rubber flooring. The company’s leadership in sustainability, underscored by its carbon negative carpet tile backings and cradle-to-gate assessments, differentiates it within a competitive and cyclical flooring market. Geographic diversification, especially the increasing share of Americas sales, coupled with prudent capital allocation marked by dividends and buybacks, positions Interface well despite debt-related risks and supply chain complexities.
Historical Growth Trajectory and Key Earnings Drivers
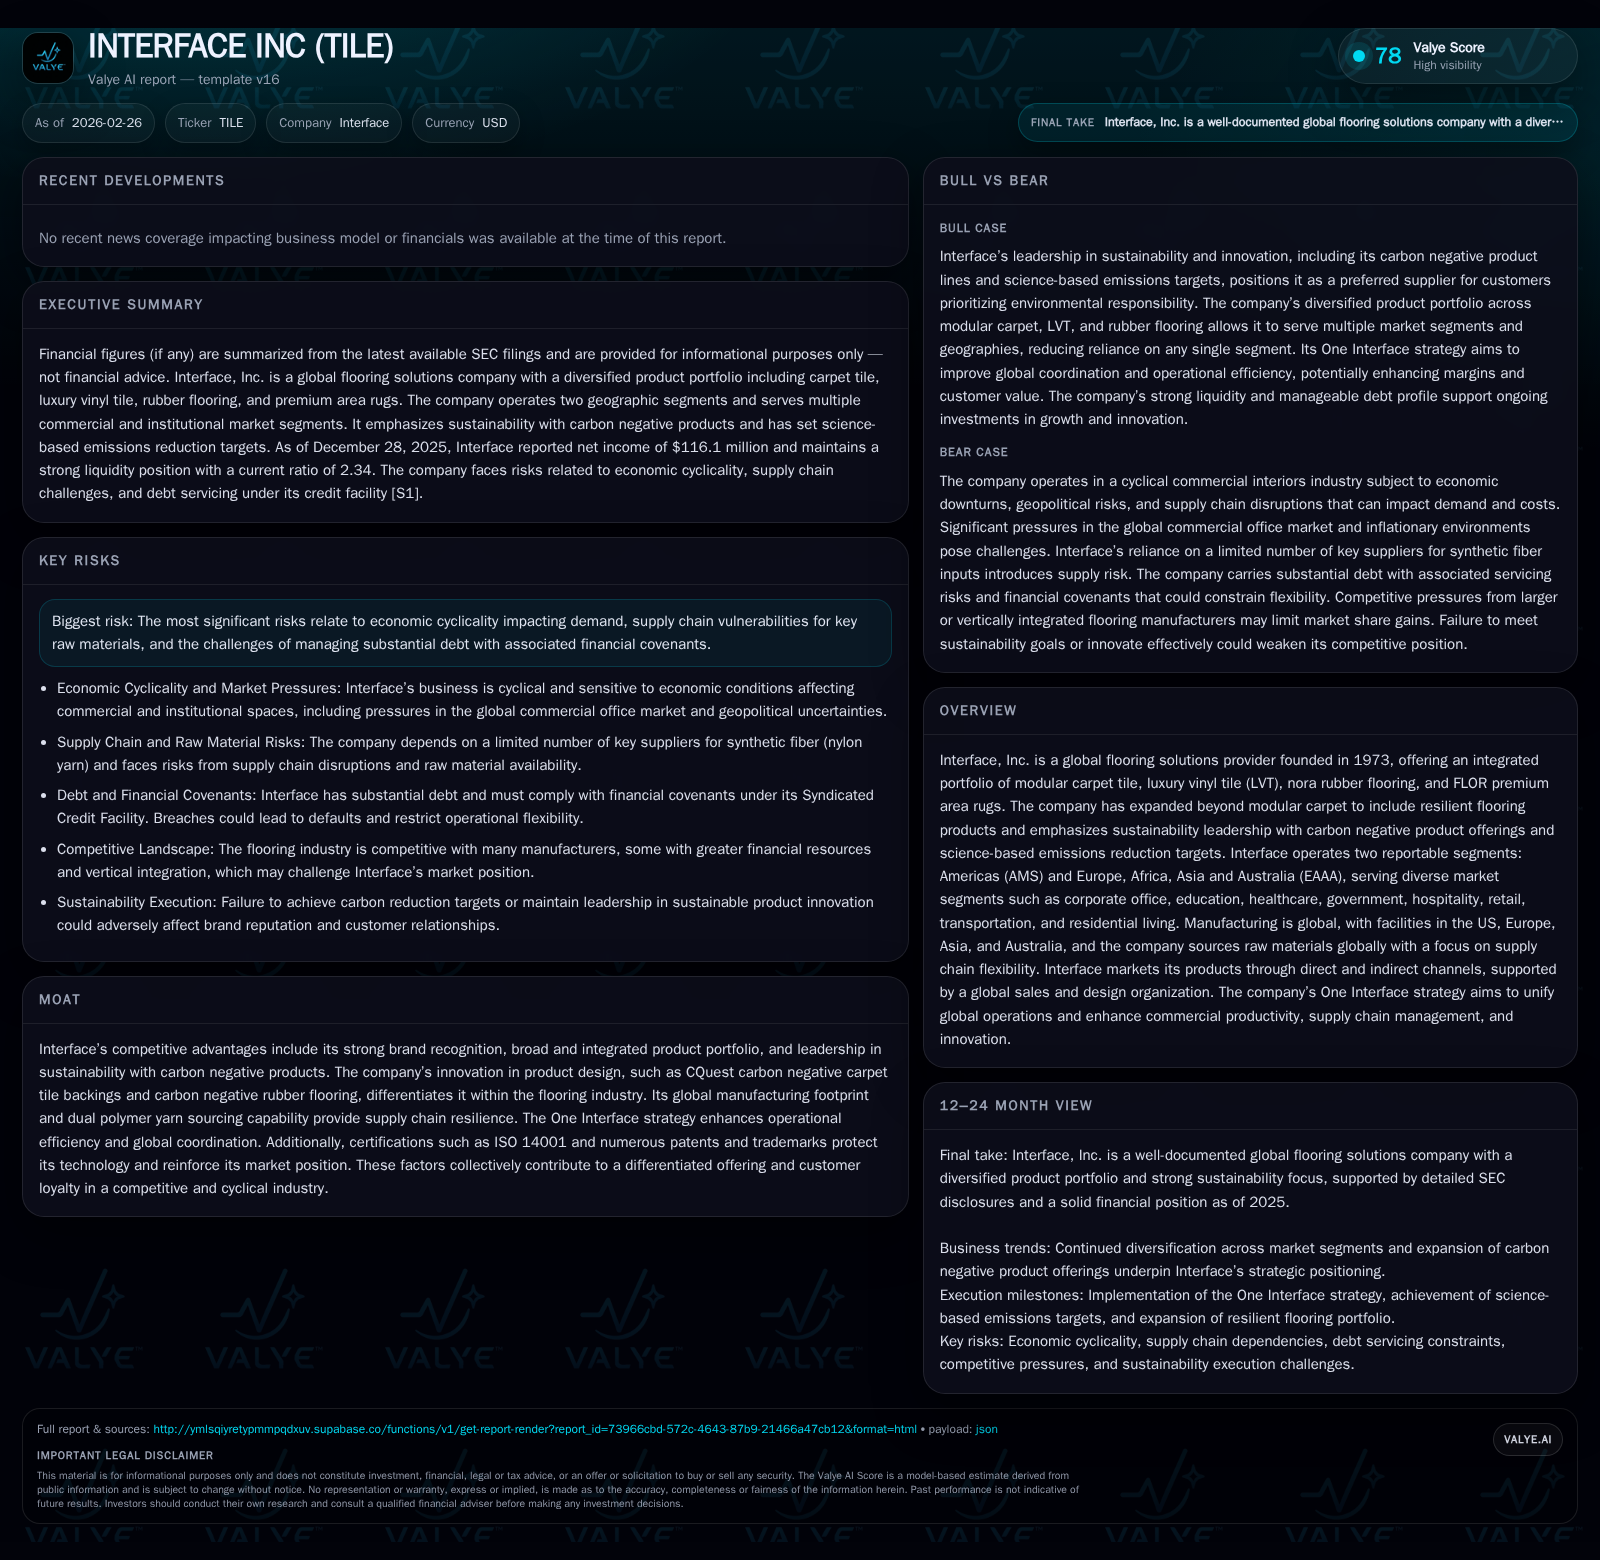
Interface Inc’s financial performance through FY2025 reflects strong momentum shaped by strategic product diversification and operational improvements. Operating income rose 22% year-over-year to $163.995 million, up from $134.406 million in FY2024, highlighting improved profitability amid industry cyclicality [F1]. Net income increased 33.5% to $116.1 million compared to $86.9 million the prior year, signaling efficient cost management and favorable product mix shifts.
This earnings growth was supported by expansion beyond modular carpet into resilient flooring categories such as luxury vinyl tile (LVT) and nora rubber flooring, addressing sectors like healthcare, education, transportation, hospitality, alongside its core corporate office base. Operational leverage benefited from the One Interface initiative which enhances global coordination across sites to tighten cost structures and accelerate decision-making.
Historical performance (annual)
| FY | Net ($mm) | CFO ($mm) | OpInc ($mm) | Capex ($mm) | Net YoY |
|---|---|---|---|---|---|
| 2025 | 116 | 168 | 164 | 46 | +33.5% |
| 2024 | 87 | 148 | 134 | 34 | +95.3% |
| 2023 | 45 | 142 | 105 | 26 | +127.6% |
| 2022 | 20 | 43 | 75 | 18 |
Source: SEC companyfacts cache [F1].
Capital returns and efficiency (annual)
| FY | Div ($mm) | Buybacks ($mm) | FCF ($mm) |
|---|---|---|---|
| 2025 | 4 | 18 | 122 |
| 2024 | 2 | 0 | 115 |
| 2023 | 2 | 0 | 116 |
| 2022 | 2 | 17 | 25 |
Source: SEC companyfacts cache [F1].
Product Evolution: From Modular Carpet to Integrated Flooring Solutions
Originally focused on modular carpet tiles under the Interface® brand, the company has broadened its offerings to include LVT, carbon negative nora rubber flooring, and FLOR premium area rugs for residential and commercial spaces [S1], [S8], [S10].
The introduction of CQuest™ carbon negative carpet tile backings exemplifies technological innovation using bio-based materials aligned with customer demands for sustainability credentials—particularly important in education and healthcare sectors where embodied carbon considerations are increasingly factored into procurement decisions [S11], [S25].
The acquisition of nora systems GmbH expanded Interface’s resilient flooring portfolio with rubber solutions free of PVC or phthalates designed for demanding environments such as transportation hubs and hospitals where durability and safety are critical purchasing factors [S8], [S19].
This integrated portfolio allows seamless installation across carpet tiles, LVTs, and rubber floors due to matching product heights minimizing the need for transition strips—a valued feature for designers seeking clean aesthetics.
Geographic Sales Mix and Segment Dynamics
Interface operates through two principal segments: Americas (AMS), covering North and Latin America; Europe, Africa, Asia & Australia (EAAA). AMS represented about 61% of net sales in FY2025 versus roughly 58% in FY2023—a shift reflecting stronger growth or market penetration in the Americas despite macroeconomic challenges including tariffs and geopolitical tensions impacting EAAA operations [F1], [S4].
The EAAA segment contributes around 39%, facing pressures from higher energy costs tied to natural gas supply issues affecting European manufacturing alongside softening commercial office demand in major cities where key plants operate [S21].
Both segments experience cyclical dynamics linked to commercial interiors markets but benefit from diversified exposure spanning corporate offices balanced against healthcare expansions and educational infrastructure investments.
Sustainability as a Competitive Differentiator
A core competitive advantage is Interface’s deep commitment to sustainability embedded throughout product development and operations.
Its carbon negative carpet tiles utilize cradle-to-gate lifecycle assessments ensuring embodied carbon emissions are minimized or net-negative relative to conventional products—an increasingly important criterion as customers require verifiable environmental performance prior to selection [S11], [S25].
All manufacturing sites maintain ISO14001 certification underscoring rigorous environmental management enhancing supply chain reliability while appealing to green procurement protocols common among governments, higher education institutions, and healthcare clients.
Additionally, the ReEntry® take-back program supports circular economy principles by recycling used tiles into new products reducing landfill waste.
These initiatives serve as meaningful barriers against competitors lacking similar depth in carbon analytics or product certifications.
Capital Allocation: Returns, Dividends, and Buybacks
In FY2025, Interface deployed approximately $18.2 million towards share repurchases following two years without buybacks while maintaining dividend payments near $3.56 million—reflecting consistent shareholder cash returns balanced with reinvestment needs [F1].
Operating cash flow totaled roughly $167.9 million against capital expenditures of $46.2 million yielding free cash flow near $121.7 million providing liquidity for strategic investments including R&D focused on sustainability innovation.
Return on equity stands at approximately 18.1%, demonstrating effective shareholder capital utilization amid ongoing portfolio expansion.
Debt Profile and Liquidity Considerations
Despite positive free cash flow generation supporting liquidity (current ratio around 2.34), Interface carries significant debt obligations totaling approximately $182 million at fiscal year-end December 2025 subject to financial covenants under its Syndicated Credit Facility requiring leverage ratios below three times secured net leverage and interest coverage above 2.25 times among others [S6], [S9], [S12].
Refinancing timing will be critical given debt maturities alongside sensitivity of interest costs tied largely to variable SOFR-indexed rates.
Cash flow adequacy is essential not only for servicing interest/principal but also preserving operational flexibility within a cyclical industry sensitive to external shocks such as trade disputes affecting imported LVT components sourced from South Korea.
Prudent liquidity management combined with sustained profitability mitigates immediate default risks though covenant compliance should be monitored closely through ongoing filings.
Outlook: Market Dynamics and Operational Focus
Management commentary indicates optimism driven by resilient flooring market growth fueled by public sector spending increases notably in education facility upgrades post-pandemic plus hospitality renovations paralleling tourism recovery alongside select commercial office segment stabilization as lease activities normalize post-hybrid work adoption [N1], [S1].
Challenges persist including inflationary pressures constraining customer capital expenditures alongside raw material price volatility affecting nylon yarn inputs—partially offset by dual polymer sourcing capability between nylon-6 and nylon-6,6 polymers enhancing supply flexibility [S8], [N1], [S5].
Competitive intensity remains elevated as larger manufacturers increase capacity potentially triggering pricing pressure requiring continued innovation without margin erosion.
Geopolitical factors such as tariffs on LVT imports elevate cost risks necessitating agile pricing strategies balanced against demand elasticity considerations.
Innovation Pipeline and Operational Efficiencies
Key initiatives include the One Interface strategy unifying global operations harmonizing product lines across manufacturing sites located in the US (LaGrange), Europe (Netherlands/UK/Germany), Asia (China), Australia enabling scale advantages alongside responsiveness improvements facilitating accelerated new product introductions supported by agile raw material dual sourcing enhancing resilience against supplier disruptions [N3].
R&D efforts focus on proprietary backing technologies extending the CQuest™ platform embedding bio-based polymers increasing recycled content while preserving durability standards critical for commercial applications.
Operational simplification including supply chain consolidation aims to improve margins enabling competitive pricing agility amid intensifying market rivalry.
Monitoring these developments provides insight into sustainability competitiveness and margin trajectories beyond cyclical top-line variability.
This analysis offers an informed assessment of Interface Inc’s evolving business dynamics within its industry context based on publicly available disclosures without investment recommendation or projection implied.
Disclaimer: This is research-only, informational analysis and not investment advice. It may include AI-generated interpretation and general industry context. Always verify important details using primary sources.
Comments