
URSB Bancorp’s Strategic Shift from Mutuality: Early Financial Performance and Regional Growth Outlook
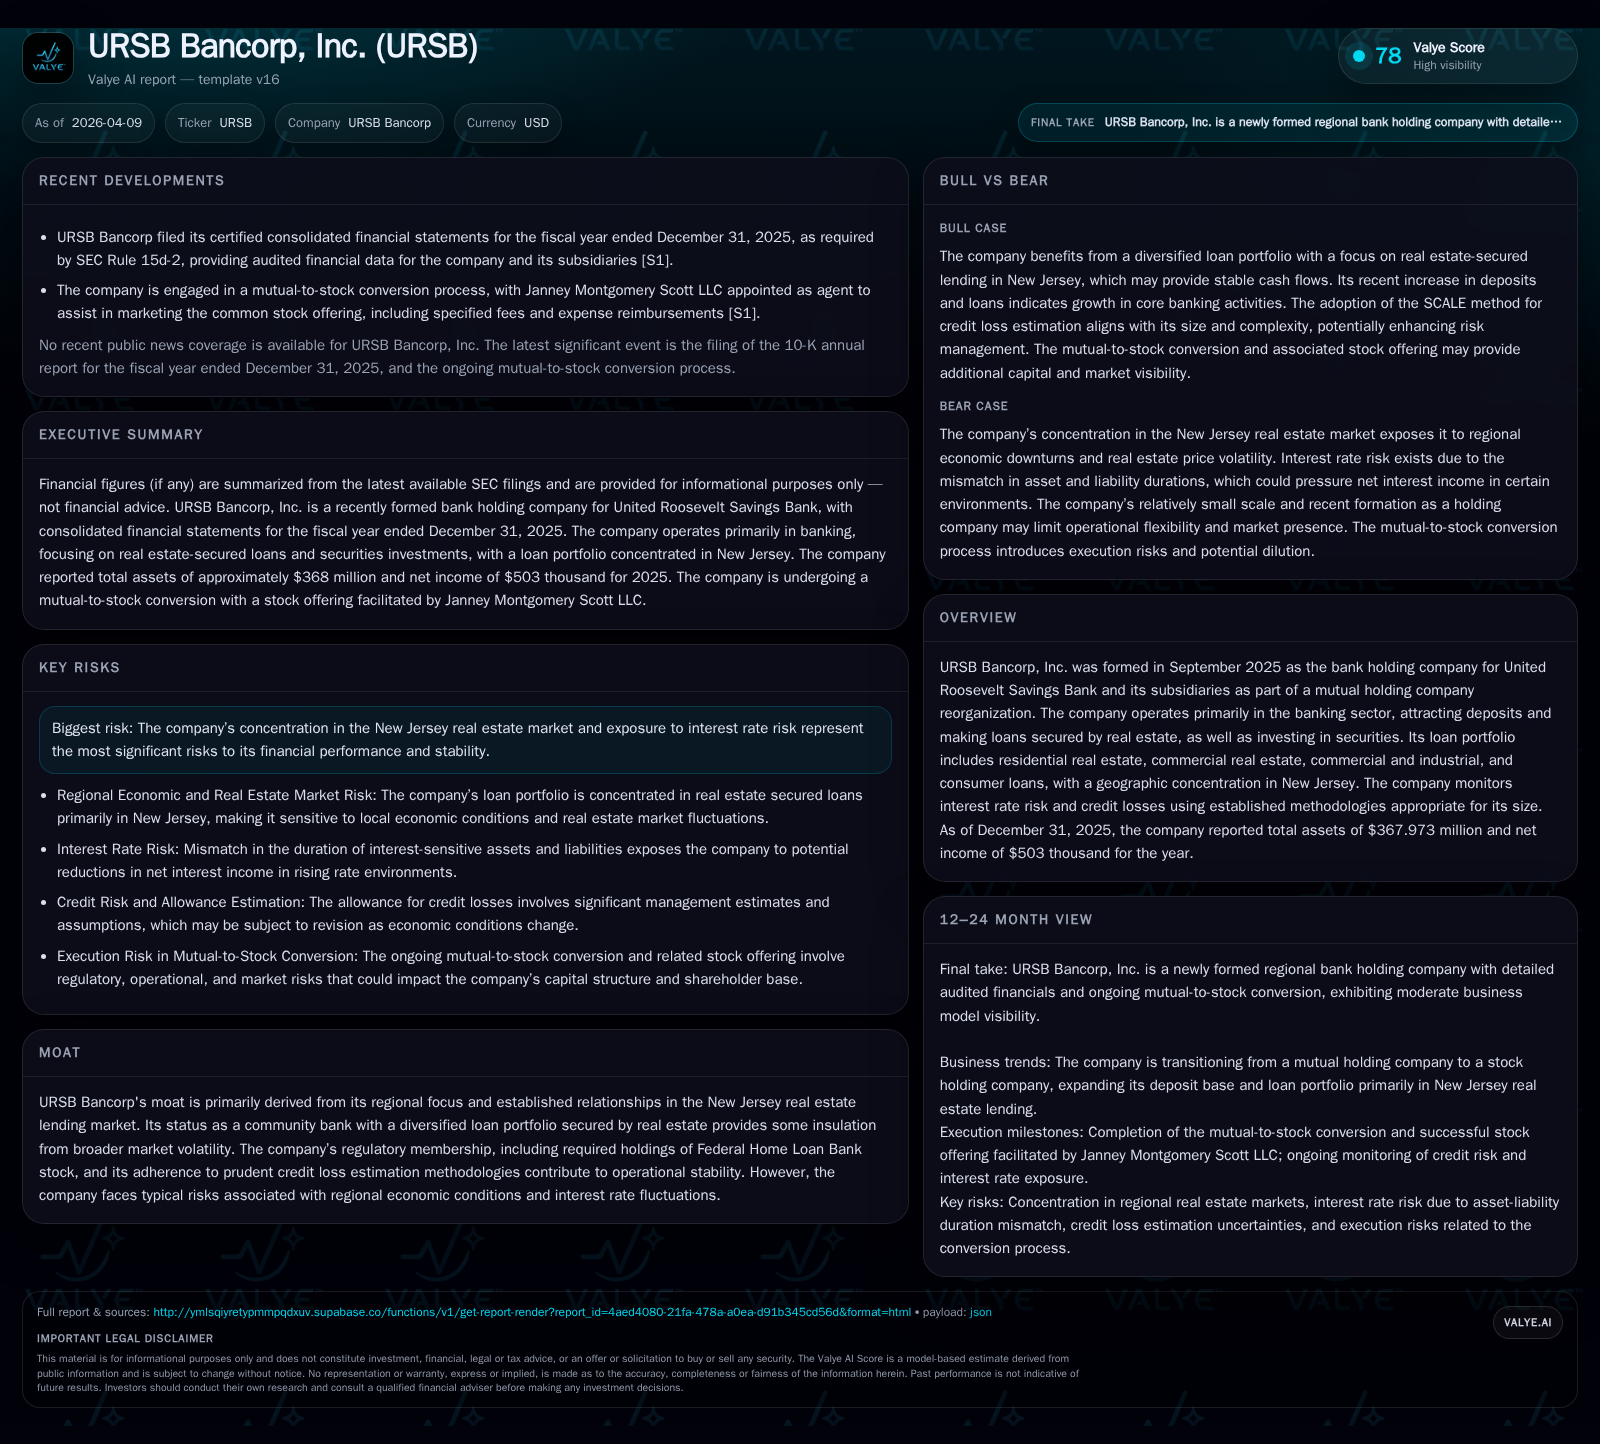
URSB Bancorp launched in late 2025 as a stock holding company reorganization, marking a new chapter with $368 million in assets and cautious profitability amid New Jersey real estate concentration.
URSB Bancorp, Inc. was formed in September 2025 through the mutual holding company reorganization of United Roosevelt Savings Bank, transitioning from mutual to stock ownership. Its inaugural fiscal year ended with $367.973 million in total assets and net income of $503 thousand, reflecting the typical modest profitability profile of a newly public regional bank. The loan portfolio remains heavily concentrated in New Jersey real estate across residential and commercial sectors, underpinned by community banking relationships and prudent credit loss methodologies. Interest rate risk is managed through ongoing maturity structure monitoring, yet the regional economic dependency constrains growth visibility. Capital allocation focuses on building retained earnings with no current dividend or buyback programs, setting the stage for organic growth and potential strategic milestones to follow.
Formation through Mutual Holding Company Reorganization and Its Industry Implications
URSB Bancorp, Inc. was formed in late 2025 as the stock holding company for United Roosevelt Savings Bank, following a mutual-to-stock reorganization process finalized on September 8, 2025 [S1], [S3]. This structural transition is relatively uncommon within community banking circles where mutual ownership has long been a favored model for preserving local control. By converting to a stock ownership framework, URSB established a platform aimed at balancing traditional community banking values with enhanced capital flexibility and transparency demanded by public markets. The holding company serves primarily as an intermediate entity owning all shares of the bank and related subsidiaries such as an investment company focused on mortgage-backed securities [S4].
This reorganization provides URSB access to broader capital markets while maintaining its foundational focus on serving New Jersey’s regional borrowers. It also imposes increased regulatory reporting obligations that bring greater scrutiny to financial results and risk management practices. As a community bank with roots deeply embedded in the region’s real estate lending ecosystem, this structural shift sets a baseline for future strategic initiatives including possible expansions or capital deployments.
2025 Financial Performance Metrics: Revenue, Net Income, and Asset Base Evolution
In its inaugural fiscal year post-formation (calendar year ended December 31, 2025), URSB Bancorp reported total assets of $367.973 million and generated net income of $503 thousand [F1], [S1]. These results provide an early snapshot of operational scale corresponding to a smaller regional bank navigating startup expenses alongside deposit-gathering and loan origination efforts. While revenue breakdown is itemized within interest income components (overall interest income rose to $17.531 million from $14.781 million prior year), net profitability is modest reflecting typical startup costs including system assimilation following reorganization.
| FY | Interest Income (USD) | Net Income (USD) | Total Assets (USD millions) |
|---|---|---|---|
| 2024 | 14,781,000 | N/A | 315.863 |
| 2025 | 17,531,000 | 503,000 | 367.973 |
The asset base grew approximately 16% year over year from the prior period indicating healthy expansion in core lending and investment activities.
Loan Portfolio Composition and Credit Quality: Concentration in New Jersey Real Estate Markets
URSB's loan portfolio as of year-end reflects its core competency: residential real estate loans ($143.6 million), commercial real estate loans ($88.1 million), followed by commercial & industrial loans ($7.94 million), specialized BHG-originated loans ($34.78 million), and consumer loans ($26.54 million) [S8]. The bulk exposure resides within New Jersey real estate markets supporting owner-occupied properties, multi-family units, speculative construction projects, and income-producing commercial properties primarily situated within state boundaries [S7].
Credit quality monitoring employs an eight-grade internal rating system categorizing loans into "pass" (grades 1-5) versus watch or impaired categories suitable for allowance assessment [S5]. The Company utilizes qualitative overlays considering borrower creditworthiness shifts, collateral valuations, economic cycles, policy changes, and local market trends in updating loan loss provisions under CECL standards consistent with community bank practice [S12], [S13].
Interest Rate Risk Management and Impact on Net Interest Income
A structural challenge facing URSB arises from its asset-liability mismatch: longer duration fixed-rate loan assets versus shorter-term repricing liabilities [S6]. In a rising interest rate environment—the scenario consistent with prevailing macroeconomic conditions—the faster repricing of liabilities compresses net interest margin unless offset by new higher-yielding loan originations or securities reinvestment.
Management actively monitors repricing gaps using portfolio maturity schedules combined with sensitivity testing scenarios covering instantaneous rate shocks and gradual yield curve shifts common in banking sector asset-liability management frameworks.
Capital Structure, Liquidity Position, and Debt Profile Post-Reorganization
At December 31, 2025, URSB held deposits totaling approximately $290.95 million up from about $246 million prior year supporting liquidity needs along with borrowings including Federal Home Loan Bank advances secured against eligible collateral such as government obligations totaling roughly $53.6 million [S10], [S22].
The Company owns restricted Federal Home Loan Bank stock valued at approximately $2.37 million per regulatory mandate which bears no impairment charge due to robust FHLB capital positions [S24]. Liquidity metrics indicate sound cash holdings ($8.39 million) complemented by investments classified as available-for-sale or held-to-maturity securities diversified across agency securities, mortgage-backed securities and corporate bonds totaling over $38 million offering stable cash flow streams with limited credit risk exposure [S11], [S21].
No material debt issuances beyond traditional short- or long-term advances were reported highlighting reliance on balance sheet funding rather than capital markets leverage.
Allowance for Credit Losses Analysis by Loan Segments
Total allowance for credit losses on loans stood at approximately $2.277 million at year-end versus $1.363 million prior period reflecting both portfolio volume growth and conservative provisioning aligned to observed risk patterns [S8]. Breakdowns indicate rising reserves notably in residential real estate whereas commercial real estate ACL reflects partial reserve utilization due to portfolio shifts [S5]. Charge-offs remain limited (-$90k net), suggesting disciplined underwriting combined with proactive loss identification.
URSB’s adoption of the Federal Reserve’s SCALE CECL methodology represents a pragmatic alignment of allowance estimation complexity tailored for institutions under $1 billion assets balancing model transparency with forecasting capability [S12]. Management overlays include assessing borrower credit quality trends, loan policy adjustments, collateral valuations specific to each segment’s inherent risk profile.
Outlook on Organic Growth Considering Regional Economic Conditions and Regulatory Frameworks
Looking forward, URSB’s growth prospects hinge critically on New Jersey’s real estate market trajectories given geographic concentration risks highlighted throughout filings [S1], [S3]. A stable or improving housing demand environment could foster incremental loan volume growth particularly in owner-occupied residential sectors which historically drive lower charge-off rates.
Conversely, potential slowdowns or regulatory headwinds affecting construction financing or commercial property sectors could impose constraints requiring portfolio mix recalibrations.
The absence of explicit company guidance behooves stakeholders to monitor quarterly updates on loan origination volumes, deposit expansion trends,and nonperforming asset movements as leading indicators.
Capital Allocation Strategy: Cash Flows and Shareholder Returns Prospects
Given the nascent profitability stage (net income just over half a million dollars), URSB reports no dividends or share repurchases reflective of typical early life-cycle policies aiming at capital retention for organic balance sheet strengthening rather than immediate shareholder yield generation [F1], [S1]. Cash flows from operating activities are modestly positive paralleling low net income levels.
Without disclosed return on equity figures explicitly reported yet indicative ratios would be low due primarily to startup period costs relative to equity base near $20 million [F1]. Prudent internal capital accumulation remains essential before external distributions can be contemplated especially under evolving regulatory capital adequacy expectations applicable to regional banks transitioning ownership structures.
Key Milestones and Developments to Monitor in URSB’s Emerging Public Life
As URSB Bancorp matures beyond its mutual conversion milestone achieved in late 2025 [S3], critical performance metrics warrant close observation over ensuing quarters:
- Growth rate of new loan originations segmented by product type (residential vs commercial)
- Trends in allowance for credit losses vis-à-vis charge-offs signaling asset quality trajectory amid economic shifts
- Deposit gathering pace reflecting competitive positioning within local banking markets
- Evolution of net interest margin impacted by interest rate cycles and asset-liability repricing dynamics
- Regulatory communications around capital targets related to newly established public company status
- Any announcements regarding strategic partnerships or expansions possibly leveraging BHG-originated small business lending capabilities
Forward-looking commentary around these facets remains limited; therefore conventional vigilance around SEC filings plus regional market intelligence will serve best to gauge trajectory without extrapolative forecasts.
Disclaimer: This report is prepared solely for informational purposes based on publicly available data as of April 9, 2026. It does not constitute investment advice or an offer to buy/sell securities.
Disclaimer: This is research-only, informational analysis and not investment advice. It may include AI-generated interpretation and general industry context. Always verify important details using primary sources.
Comments