
Richardson Electronics Faces Profitability Challenges Amid Modest Sales Growth and Strategic Asset Disposition
The company shows mixed financial performance with a slight revenue increase offset by operating losses, following portfolio streamlining.
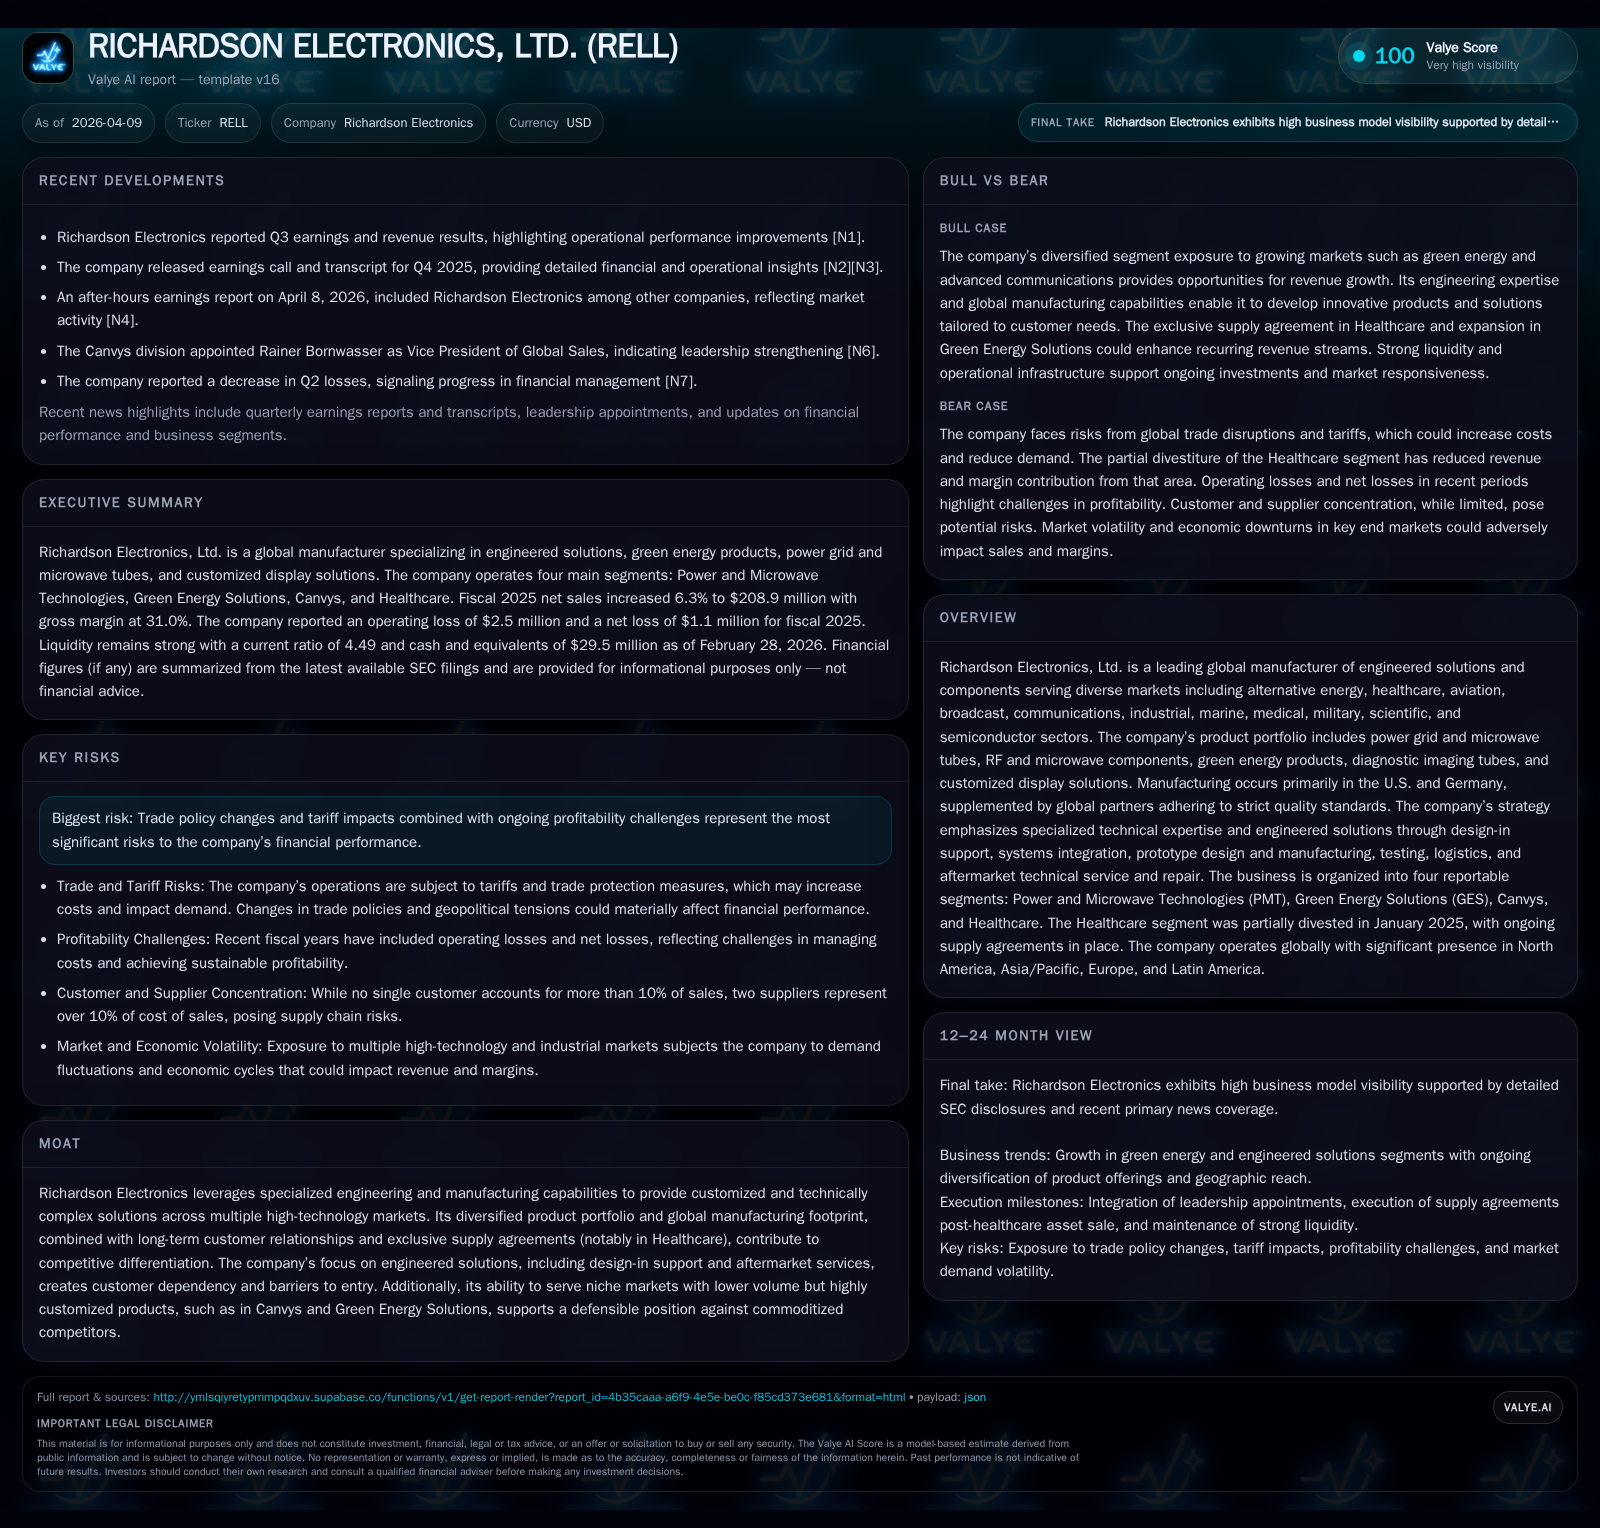
Richardson Electronics’ fiscal 2025 saw a 6.3% rise in net sales to $208.9 million but a swing to an operating loss of $2.5 million from a small operating income the prior year, impacted by a $5.1 million loss linked to its Healthcare asset sale. Despite improved gross margins driven by favorable product mix and segment growth in Power and Microwave Technologies (PMT) and Green Energy Solutions (GES), overall profitability was pressured by restructuring effects and higher operational costs. The company's sizable cash reserves and positive operating cash flow underpin short-term liquidity, while ongoing risks include trade policy impacts and competitive market dynamics in niche high-tech segments. Future growth depends on capturing expanding markets like green energy storage and semiconductor fabrication equipment components.
Company Overview
Richardson Electronics, Ltd., trading as RELL on NASDAQ, is a diversified global manufacturer providing engineered solutions primarily for high-technology sectors such as alternative energy, healthcare, semiconductor manufacturing, broadcast communications, and military applications [S1][S4]. Its product suite ranges from power grid and microwave tubes to custom display solutions through four segments: Power and Microwave Technologies (PMT), Green Energy Solutions (GES), Canvys (custom displays), and Healthcare [S4][S8][S12]. Manufacturing occurs mainly in the U.S. and Germany with supplemental global sourcing under rigorous quality standards.
The company pursues a strategy focused on specialized engineering expertise, offering design-in support, systems integration, prototyping, testing services, logistics, as well as aftermarket repair services [S4][S12]. This positioned Richardson Carswell as a provider of technically complex, often customized products that are difficult for commodity competitors to replicate.
Past Growth and Historical Performance
Over the last few years, Richardson’s revenues show volatility linked to sector cyclicality and strategic portfolio shifts such as divestitures:
Historical performance (annual)
| FY | Net ($mm) | CFO ($mm) | OpInc ($mm) | Capex ($mm) | Net YoY |
|---|---|---|---|---|---|
| 2025 | 1 | 11 | -2 | 3 | +1003.4% |
| 2024 | 0 | 7 | 0 | 4 | -102.9% |
| 2023 | 4 | -8 | 25 | 7 | -50.3% |
| 2022 | 8 | 2 | 16 | 3 |
Source: SEC companyfacts cache [F1].
Capital returns and efficiency (annual)
| FY | FCF ($mm) | ROE% |
|---|---|---|
| 2025 | 8 | 0.7 |
| 2024 | 2 | -0.1 |
| 2023 | -16 | 2.6 |
| 2022 | -1 | 6.1 |
Source: SEC companyfacts cache [F1].
Richardson experienced meaningful revenue declines in FY2023 versus FY2022 (down ~25%) primarily due to weakened end markets in semi-wafer fabrication equipment demand reflected mostly in PMT segment results [S10][S13]. However, FY2025 reversed this trend with modest overall top-line growth (+6%) chiefly driven by recovery in key segments—especially Green Energy Solutions (+23%) [S10].
While revenue stabilized or grew slightly post-divestiture of substantial Healthcare assets in January 2025 (which produced a loss of $5.1 million recorded in fiscal year ended May 31, 2025), profitability faced headwinds resulting in operating losses despite growing gross profit margins [S4][S10][F1]. Gross margin improvement to approximately 31% during FY2025 (from about ~30% prior year) reflected better product mix—such as increased engineered solution sales—and cost controls partially offset by absorption challenges in manufacturing [S13].
Segment Performance Highlights
Power & Microwave Technologies (PMT): Experienced a rebound with sales rising approximately +7% to nearly $138 million supported by semiconductor wafer fabrication components and increased RF/Wireless infrastructure demand [S10][S13]. Gross margin improved slightly due to favorable product mix despite some manufacturing absorption costs.
Green Energy Solutions (GES): Demonstrated significant growth (+23%), expanding market share through new power management products targeting fast-growing renewable energy applications including wind turbines, solar technologies, hydrogen fuel cells, electric vehicles, and synthetic diamond manufacturing processes [S10][S13][S28]. Margin expansion was attributed to increased share of engineered solutions within the segment.
Canvys: Delivered modest sales growth (+2%) after prior declines; however, gross margin compressed due to shifts towards freight costs and product composition variance [S10][S13][S29]. The segment caters to specialized low-volume display needs that benefit from customized hardware platforms.
Healthcare: Shrunk substantially (-23%) due primarily to the January 2025 sale of core healthcare assets but maintains narrow focus on repairing CT X-ray tubes under exclusive agreement with DirectMed Imaging for ten years [S4][S10]. Lower-margin spare part sales ended impacting overall gross margin negatively.
Capital Allocation & Returns
Richardson’s capital strategy remains conservative with no stock buybacks reported during FY2025 or prior years reviewed, consistent with public disclosures [S23][F1]. Dividend distributions remained steady at about $3.4 million annually funded primarily out of operations; quarterly payout rates were $0.06 per common share throughout fiscal year-ended May 2025 [S23].
Despite reporting an operating loss (-$2.5 million), the company generated positive net income ($1.1 million), largely driven by other income sources including foreign exchange gains as well as tax benefits related to deferred income taxes [F1][S10]. Cash flow from operations was robust at over $10 million reflecting collections improvements along with working capital management enhancements; capital expenditures declined versus prior year signaling controlled investment spending focused on critical production assets upgrades particularly at LaFox facilities [S14][F1][S25].
Return on equity based on latest net income over shareholders’ equity is modest at roughly 0.7%, highlighting ongoing challenges converting incremental revenue into bottom-line profits amid restructuring-related expenses and evolving market conditions [F1].
Future Growth Prospects & Challenges
The company has signaled continued emphasis on expanding its engineered solution portfolio across PMT and GES segments where secular drivers remain robust:
- Semiconductor wafer fab equipment demand rebounds could bolster PMT segment revenue further.
- Accelerating adoption of green energy technologies sustained by regulatory tailwinds may propel GES growth.
- New product introductions aiming at power storage systems and power management components will be critical growth levers.
- The Canvys division caters to customers seeking highly customized displays where volume commitments are lower but technical complexity is higher — an enduring niche with stable demand.
- Healthcare remains limited after divestiture but benefits from exclusive supply contracts providing steady predictable revenues albeit smaller scale than legacy operations [N3][N2][N1].[S4]
However, these opportunities coexist alongside significant risks:
- Tariff fluctuations and shifting trade policies create cost uncertainty particularly on imported components sourced globally requiring careful supplier relationship management [S12][S18].
- Competitive pressures exist both from commoditized suppliers in electronics components as well as larger consolidated players in semiconductor tooling services which could limit pricing flexibility.
- Profitability will depend heavily on continued operational optimization given prior operating losses despite top-line growth.
- Transition away from Healthcare asset ownership reduces diversification but focuses resources on higher-growth segments.
Monitoring near-term quarterly earnings updates will be vital for signs of margin recovery or deeper cost pressure persistence as reported recently where Q3 FY26 results exceeded consensus but did not alter guidance materially [N1][N2]. The company’s large cash reserves (~$29 million) provide financial flexibility amid uncertainties around working capital timing or potential investment requirements for capacity expansion or R&D enhancements [F1].[S14]
Conclusion
Richardson Electronics presents an illustrative case of a mid-sized industrial technology firm balancing cyclical end-markets with strategic repositioning toward more promising segments like green energy and semiconductor manufacturing solutions post Healthcare asset sale.
Fiscal year 2025 encapsulates this transition — revenue growth persisted modestly despite divestitures, but operating profit was challenged by restructuring charges and absorption issues reflective of broader industry headwinds experienced across precision electronic component suppliers globally.
A sustained focus on engineered solutions coupled with selective capital deployment underpin future growth hopes though persistent risks warrant attention given ongoing tariff exposures and competitive dynamics.
This analysis uses company filings as of April 9, 2026 ([F1],[S#]) supplemented by recent earnings reports ([N#]). It does not imply any investment recommendation.
Disclaimer: This is research-only, informational analysis and not investment advice. It may include AI-generated interpretation and general industry context. Always verify important details using primary sources.
Comments