
USA Compression’s Income Gains and Debt Management Spotlight 2025 Performance
USAC leverages fixed-fee contracts and integrated compression assets to bolster earnings amid a leveraged capital structure.
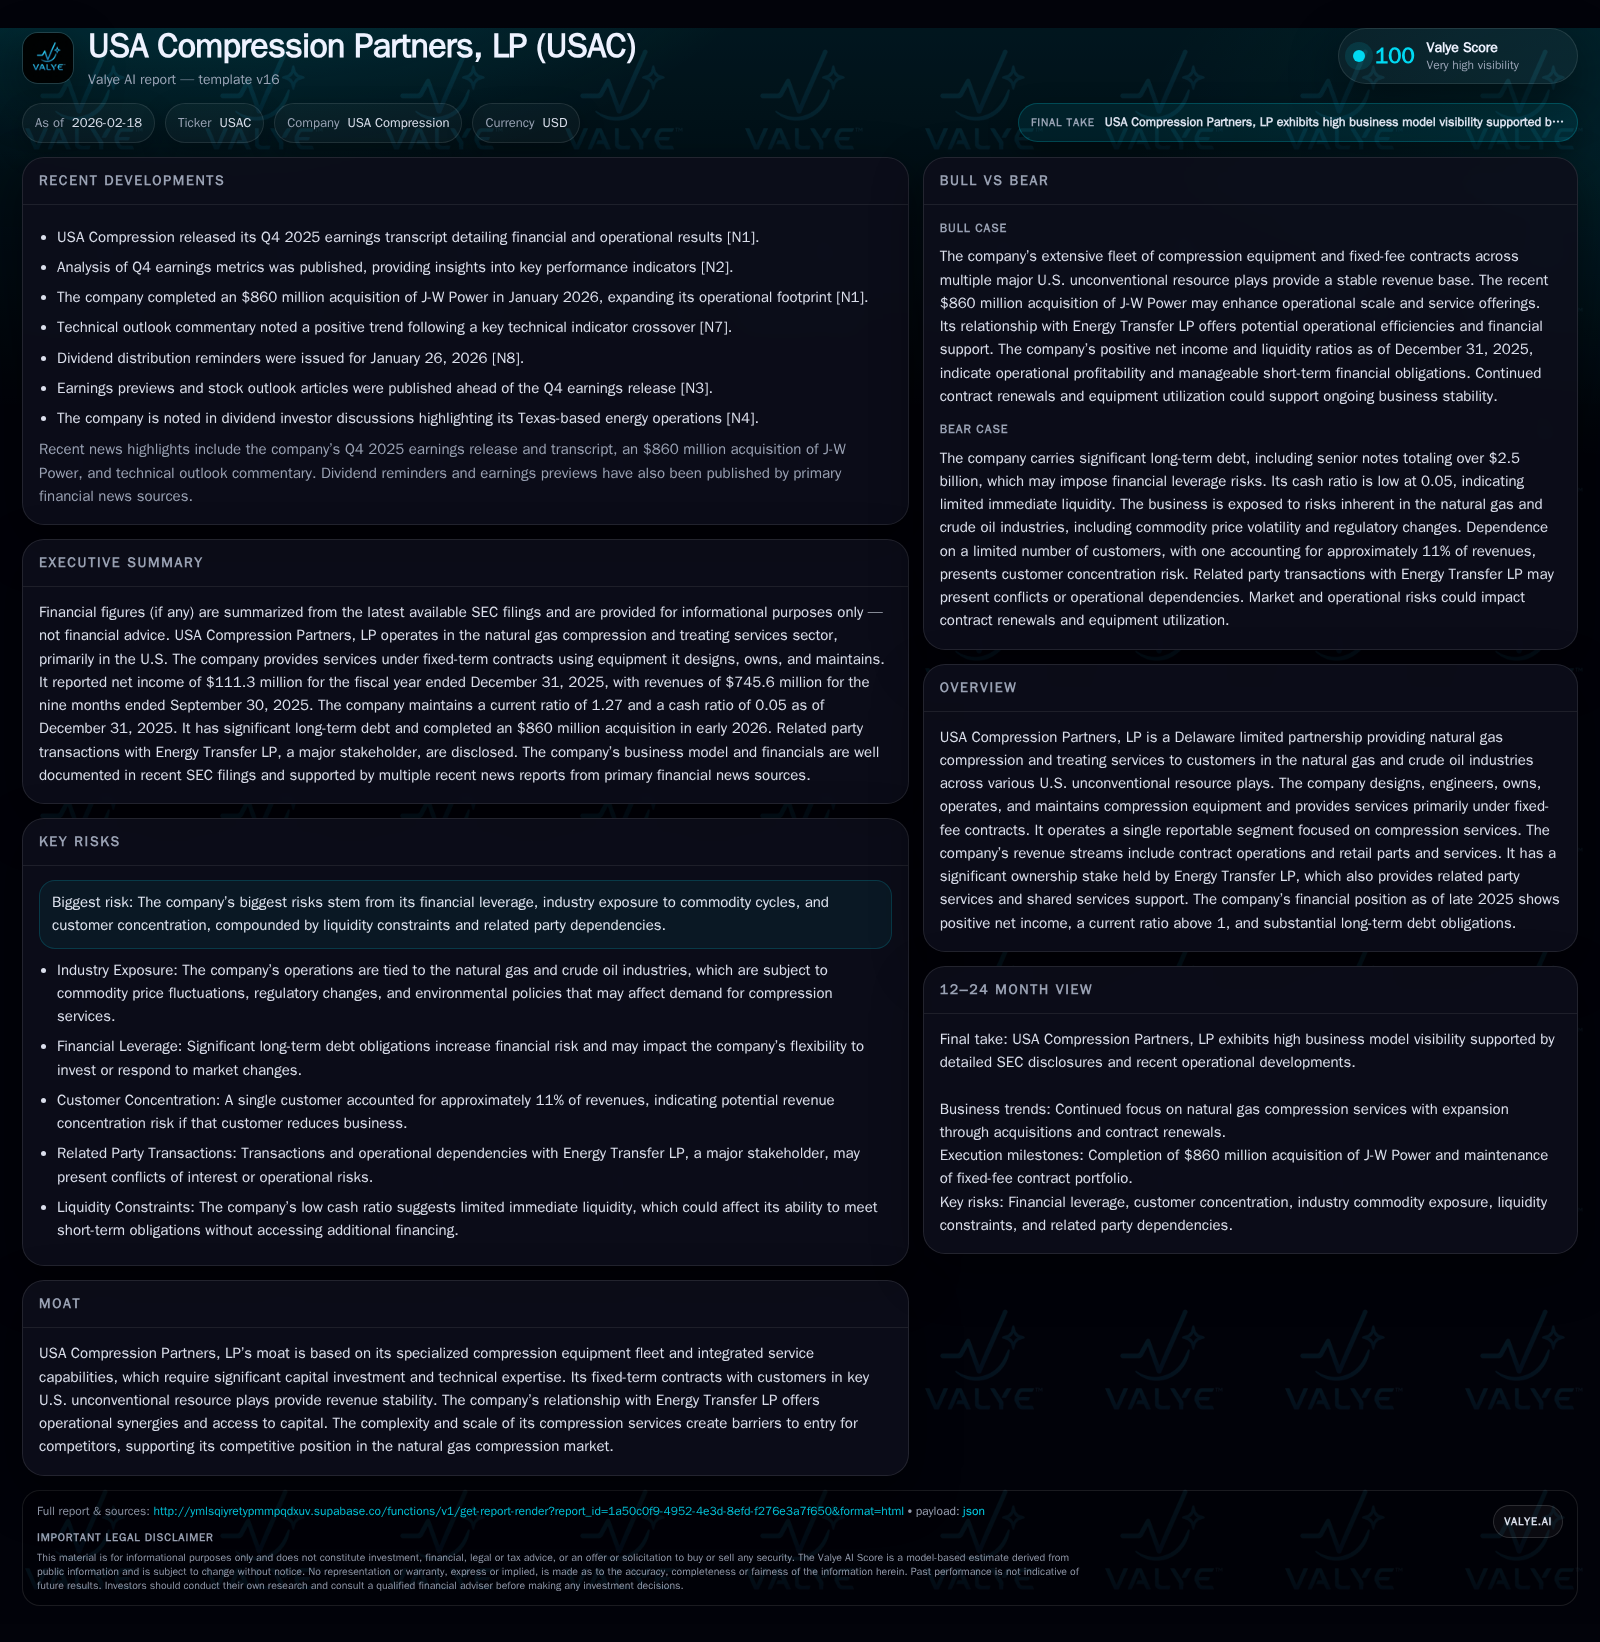
USA Compression Partners, LP demonstrated steady revenue and income growth in 2025 driven by its specialized compression fleet and long-term fixed-fee contracts. The $860 million acquisition of J-W Power expanded scale but added leverage, prompting disciplined capital expenditure management and robust cash flow generation. While contract stability anchors revenues, the company navigates liquidity through a revolving credit facility and manages substantial debt maturities with covenant compliance. Going forward, contract renewals, operational synergies with Energy Transfer LP, and macro shale gas conditions will shape growth potential, balanced against commodity cycles and related-party dependencies.
Compression Services Driving Growth: Historical Operational Highlights
USA Compression Partners has exhibited consistent revenue growth averaging around 3.6% year-over-year through fiscal 2025, reaching aggregate revenues near $1.165 billion [F1]. This advance reflects the resilience afforded by its niche positioning in natural gas compression services across multiple major U.S. unconventional plays such as Marcellus, Utica, Permian, and Eagle Ford [S20]. Operating income similarly improved by approximately 4.1% from the prior year to $306.5 million in 2025 [F1], underscoring efficient operational execution alongside stable fixed-fee contracts that buffer against abrupt commodity swings.
Net income outpaced operating gains with an increase of roughly 11.8% to $111.3 million [F1], indicating effective control of non-operational expenses and favorable cost structures amid sector cyclicality. These improvements align with the firm's integrated equipment ownership model for compression units that require tailored engineering and long service lives, creating barriers for commoditized competition.
Historical performance (annual)
| FY | Net ($mm) | CFO ($mm) | OpInc ($mm) | Capex ($mm) | Net YoY |
|---|---|---|---|---|---|
| 2025 | 111 | 394 | 307 | 117 | +11.8% |
| 2024 | 100 | 341 | 294 | 205 | +45.9% |
| 2023 | 68 | 272 | 232 | 239 | +125.2% |
| 2022 | 30 | 261 | 169 | 134 |
Note: Omitted columns lack sufficient annual XBRL coverage in the provided tags (need ≥2 annual points): Rev, Div, Buybacks, ROE%. Source: SEC companyfacts cache [F1].
Capital returns and efficiency (annual)
| FY | FCF ($mm) |
|---|---|
| 2025 | 277 |
| 2024 | 136 |
| 2023 | 33 |
| 2022 | 126 |
Source: SEC companyfacts cache [F1].
Note: All figures rounded; dividend/buyback data not available due to limitations in XBRL tags.
Contracts and Customers: The Backbone of Revenue Stability
The cornerstone of USA Compression’s revenue resilience lies in its predominantly fixed-fee contractual model supplying compression and treating services under multi-year agreements [S20][N1]. These contracts are largely volume-insensitive within defined horsepower commitments, insulating USAC from direct commodity price or production volume fluctuations—a critical advantage in the volatile upstream environment.
However, this structure entails counterparty concentration risk as major customers represent significant portions of contracted revenues; one single client accounted for approximately 11-12% of total revenues recently [S22]. Further complexity arises from the close affiliation with Energy Transfer LP — the largest unitholder possessing roughly a 38% limited partner interest as well as full ownership of the general partner entity [S22]. This alignment enables operational synergies through shared services while simultaneously heightening related-party dependency risk.
The strategic integration with Energy Transfer facilitates preferred access to capital and compressive service resources supporting key basins’ development [N11], but also requires vigilant governance given intertwined financial exposures.
Beyond Growth: Acquisition Impact and Operational Integration
In January 2026, USA Compression completed the acquisition of J-W Power for approximately $860 million in cash plus assumed liabilities [N5]. This bolt-on expanded USAC's compression fleet footprint and enhanced geographic diversification within core basins.
The transaction is expected to generate integration synergies by leveraging existing infrastructure standards and reducing overlapping maintenance costs [S4][S9]. However, it also contributed to elevated leverage levels as reflected by a net increase in long-term debt obligations exceeding $2.53 billion by end-2025 [F1]. Capital expenditure trends in the same period show a disciplined pullback—capex declined by nearly 43% year-over-year—to balance investment demands with cash flow realities post-acquisition [F1].
Consequently, USAC’s strategy balances augmenting scale via acquisitions while cautiously calibrating discretionary spending to maintain free cash flow generation capacity.
Debt Profile and Liquidity: Navigating Leverage Headwinds
USAC operates with a capital structure weighted heavily toward long-term senior notes complemented by an asset-based revolving credit facility totaling up to $1.75 billion commitment [S4][S9]. As of September 30, 2025, senior notes included $750 million due in 2033 at a coupon rate of approximately 6.25%, alongside outstanding notes maturing in ’27 and ’29 tranches yielding between ~6.9% and ~7.13% interest rates [S16][S17][S23].
Borrowings under the revolving credit facility stood at about $54.7 million with over $1 billion available considering covenant restrictions [S9]. The partnership maintains compliance with critical covenants including minimum EBITDA-to-interest coverage of at least 2.50x and total secured indebtedness to EBITDA capped at around 3x [S5][S6]. The current ratio remained comfortably above unity at about 1.27 at fiscal year-end reflecting solid short-term liquidity buffers [F1].
Despite sizable gross leverage exceeding ~5x funded debt-to-EBITDA metrics post-acquisition integration, strict credit facility restrictions channel prudent distribution policies and capex controls creating stabilizing financial discipline.
Cash Flow Generation and Capital Expenditures: The Investment Balance
Free cash flow emerges as a critical metric illuminating USAC's ability to manage its leveraged platform sustainably. In fiscal year 2025 alone, operating cash flows increased impressively by over +15%, reaching approximately $394 million driven mainly by robust operating margins underpinned by fixed fee streams [F1].
Contrasting this strong cash generation is a marked decrease in capital expenditures dropping nearly -43% relative to FY24 levels down to roughly $117 million signifying curtailment on new fleet additions or major expansions amid scrutiny on capital efficiency after acquisition spending surges [F1][S25].
Thus, USAC realized free cash flow approximating $277 million in FY25—providing ample internal funding capacity for debt servicing and distributions while preserving operational asset integrity.
Distributions and Returns: Dividend Policy Under the Microscope
Exact dividend payout figures remain undisclosed in SEC XBRL filings but external announcements confirm consistent quarterly distributions were maintained into early calendar year 2026 without defaults or covenant breaches [N10][N7][S4].
Credit agreement provisions permit distributions so long as no defaults exist, all covenants are met post-distribution including maintaining minimum liquidity buffers above ~$100 million [S4]. Given robust free cash flow coverage relative to debt service cost although leverage remains elevated, distribution reinvestments via DRIP programs have been selectively applied providing flexibility.
Return on equity metrics are not available from provided XBRL tags due to partnership accounting nuances but consistent gains in net income paired with progressive payout stability indicate shareholder value-supportive policies despite macro volatility.
Future Outlook: Market Trends, Contract Renewals, and Expansion Plans
Looking ahead, USAC management expresses cautious optimism predicated on continued strength from their portfolio of fixed-fee contracts that underpin baseline revenue visibility while incremental expansions aim at leveraging acquired assets' idle capacity post-J-W Power deal integration [N1][N11].
Capital expenditure plans appear calibrated towards demand-driven fleet upgrades rather than aggressive new builds reflecting sector-wide cautiousness amid fluctuating shale gas supply economics.[N11]
Nevertheless, contract renegotiations due over coming years present both opportunity for tariff resets aligned with inflationary pressures as well as business risk if production curtailments or competitors disrupt incumbent relationships.
Macroeconomic factors such as sustained U.S. natural gas demand growth balanced against potential regulatory headwinds will critically influence future expansion dynamics.
Risks in Focus: Commodity Cycles, Related-Party Dependencies, and Financial Covenants
While fixed-fee structures mute direct volume exposure risks relative to commodity prices themselves indirectly amplify customer activity variability potentially impacting contract renewals or volume escalators thus cascading operational challenges during downturns [S7][S12].
Moreover, reliance on Energy Transfer LP for significant business volume along with shared services linkages creates an inherent concentration risk that could magnify negative impacts from any financial or operational disruptions within that entity sphere.
Liquidity constraints compounded by USAC’s material debt profile expose the partnership to covenant breach risks particularly if adverse commodity cycles impair EBITDA generation or unexpected capital calls arise restricting distribution capacity [S7].
Close monitoring of market conditions paired with rigorous covenant compliance oversight remains paramount.
This analysis draws solely upon publicly filed financial statements up to February 2026 alongside relevant market disclosures without providing investment recommendations or pricing forecasts. Readers should consider underlying data periods’ definitions carefully when interpreting trends discussed herein.
Disclaimer: This is research-only, informational analysis and not investment advice. It may include AI-generated interpretation and general industry context. Always verify important details using primary sources.
Comments