
NatWest Group’s Growth Evolution and Strategic Capital Moves in 2025
NatWest Group's 2025 saw steady financial growth accompanied by strategic capital deployment and technology enhancements to fortify its banking franchise.
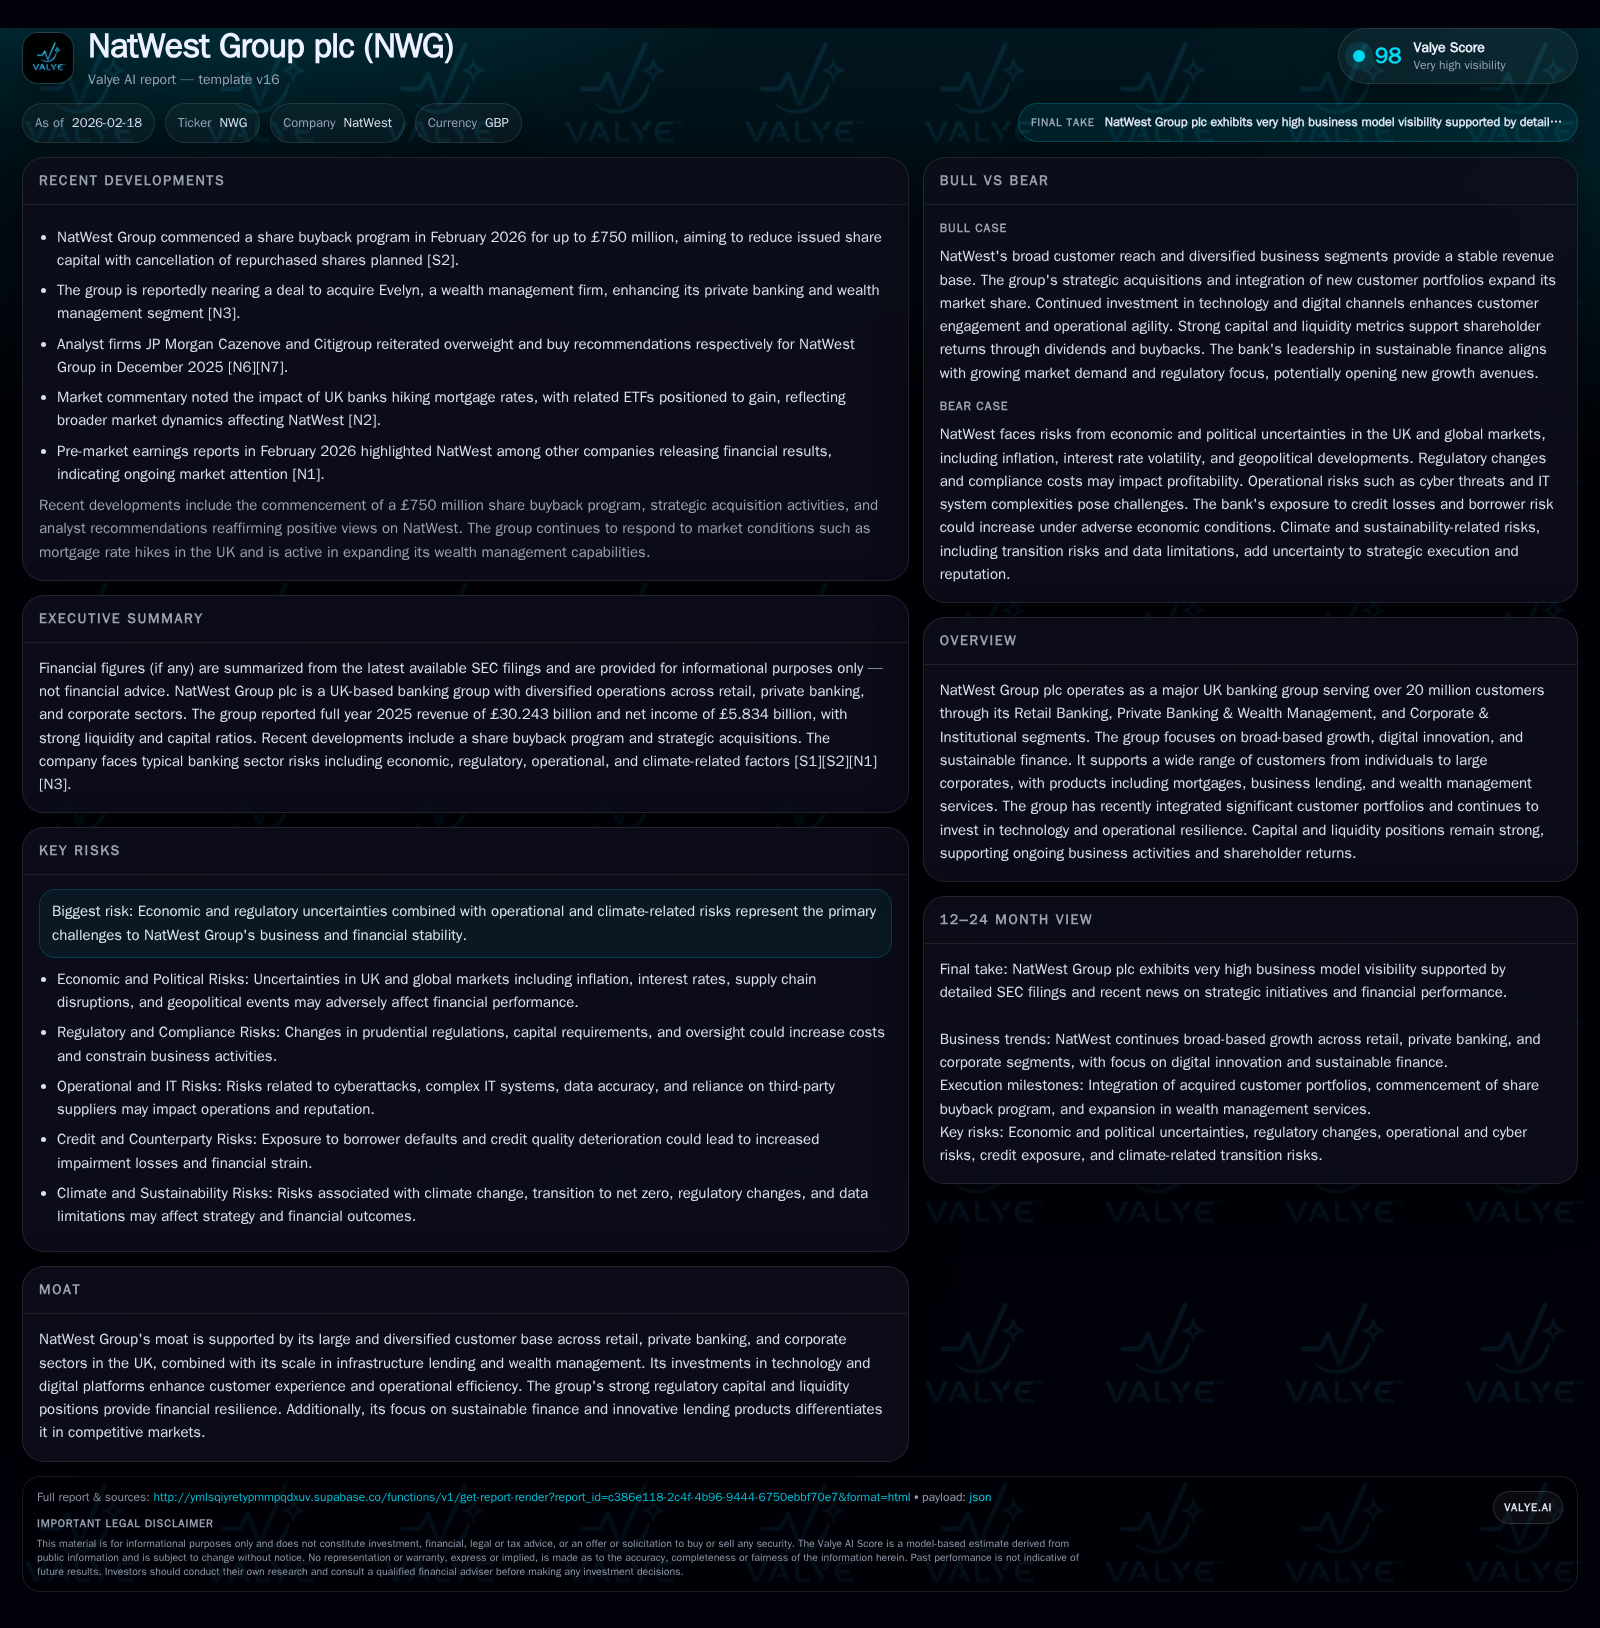
In 2025, NatWest Group expanded revenue by 3.1% and accelerated net income growth by 21.3%, illustrating enhanced profitability amid a complex economic landscape. Key growth was driven by higher retail mortgage volumes, expansion in corporate lending especially infrastructure finance, and digital innovation that improved client engagement and operational efficiency. The group maintained robust capital metrics with a CET1 ratio above regulatory targets while executing a £750 million share buyback program to optimize shareholder returns. Looking ahead, regulatory stress testing outcomes and evolving macroeconomic challenges remain critical factors for sustaining capital discipline and growth momentum.
Revenue and Profit Progression: The Last Three Years
The trajectory of NatWest Group’s top-line revenues has been marked by robust recovery and incremental gains following the pandemic-induced financial environment shifts. Revenues surged from £16.57 billion in FY2022 to £25.38 billion in FY2023 (+53.2%), driven largely by normalization of lending activities and fee income recovery after the downturn. Growth moderated but remained positive at +15.4% in FY2024 reaching £29.32 billion and further stabilized to +3.1% in FY2025, culminating at £30.24 billion [F1]. This moderation reflects more mature market conditions but sustained expansion across broad banking franchises.
More strikingly, net income displayed healthier acceleration with FY2025 earnings of £5.83 billion representing a phenomenal 21.3% increase over FY2024’s £4.81 billion [F1]. This margin improvement signals enhanced operating leverage as NatWest optimized expense control amid revenue growth while managing credit risks prudently. Equity capital rose consistently over this period from £36.50 billion to £42.61 billion by FY2025, supporting business scale without leveraging excessively.
Historical performance (annual)
| FY | Rev ($bn) | Net ($bn) | Rev YoY | Net YoY |
|---|---|---|---|---|
| 2025 | 30.2 | 5.8 | +3.1% | +21.3% |
| 2024 | 29.3 | 4.8 | +15.5% | +3.9% |
| 2023 | 25.4 | 4.6 | +53.1% | +28.8% |
| 2022 | 16.6 | 3.6 |
Note: Omitted columns lack sufficient annual XBRL coverage in the provided tags (need ≥2 annual points): CFO, OpInc, Capex, Div, Buybacks, FCF. Source: SEC companyfacts cache [F1].
Capital returns and efficiency (annual)
| FY | ROE% |
|---|---|
| 2025 | 13.7 |
| 2024 | 12.2 |
| 2023 | 12.5 |
| 2022 | 9.9 |
Source: SEC companyfacts cache [F1].
Note: Operating income, cash flow, capex, dividends, buybacks not disclosed per SEC filings; ROE derived as Net Income / Equity [F1].
Key Growth Drivers Behind NatWest’s Performance Uptick
Several operational pillars underpin revenue and profit uplift in recent years: retail mortgage origination volume increased notably as post-pandemic demand for home lending sustained; Corporate & Institutional segments grew via expanded infrastructure lending—a historically high-ticket but highly specialized segment crucial to UK economic policy priorities like social housing—with financial commitments surpassing £8.7 billion as of end-2025 [N2,S1]. Wealth management also scaled aided by rising assets under management reflecting favorable market valuations and net inflows.
Digital innovation constitutes a significant strategic enabler: AI-driven transcription and summarization enhanced front-line relationship managers’ focus on personalized engagements rather than transactional workload, improving client satisfaction and cross-selling capacity while reducing operational friction points within loan origination and service processes [S1].
Additionally, sustainable finance has emerged as an integral moat component—NatWest committed €16+ billion toward climate-aligned investments fostering transition finance for customers shifting away from carbon-intensive sectors; this aligns with regulatory ESG expectations and reinforces competitive differentiation in corporate banking landscapes increasingly shaped by non-financial risk considerations [S1].
Emerging Headwinds: Regulatory and Market Risks
Despite strong gains, NatWest confronts multifaceted challenges requiring measured vigilance:
- Macroeconomic headwinds include elevated UK mortgage rates driven by tighter monetary policy cycles impacting affordability and potential loan demand reduction or credit stress within retail portfolios [N3].
- Regulatory frameworks tighten continuously; NatWest navigated the Bank of England’s biennial BCST stress test in Dec-2025 successfully but must maintain a CET1 buffer (~14%) comfortably above the minimum ~7% threshold given supervisory scrutiny around ICAAP modeling assumptions including vulnerability-based scenarios [S1].
- Climate-related risks impose novel uncertainty vectors: internal modelling integrates physical impact scenarios and transition risk estimates within credit impairment frameworks (IFRS9) yet limitations in climate data maturity introduce forecasting ambiguity delaying capital calibration decisions [S1].
- Operational risk persists elevated amid ongoing digital transformations requiring rigorous cybersecurity measures to protect client data integrity amid increasing cyber threat sophistication [S1].
Capital Allocation Priorities and Financial Resilience
Capital discipline remains core to NatWest’s strategic framework balancing organic growth with investor return objectives:
- A new share repurchase mandate was launched early Feb-2026 for up to £750 million intended for execution through January/February 2027 timeframe with shares being cancelled post-purchase effectively enhancing EPS via reduced share count [S2,S3,S4].
- The CET1 ratio stood robustly at ~14% at year-end well exceeding internal targets around ~13%, supported by retained earnings generation aligning with the bank’s medium-term risk appetite statements; this buffer supports capital distributions including dividends whose specifics are undisclosed in available filings but consistent with regulatory limits under MDA rules [S6,S15].
- Liquidity metrics such as LCR (>147%) and NSFR (>135%) underscore healthy funding structures enabling resilience against volatile wholesale funding markets [S8,S10].
ROE approximated at a steady ~13.7%, reflective of enhanced earnings quality amidst controlled risk-weighted asset expansion primarily concentrated in strategic businesses [F1].
Digital Innovation and Sustainable Finance: Building Moat Value
NatWest continues to integrate advanced technology solutions such as generative AI across complaint handling workflows – automating transcription creates headroom for staff to deepen advisory roles rather than administrative functions which synchronizes well with UK banking sector trends focusing on superior client UX while achieving cost-income efficiency improvements [S1]. These investments reinforce operational resilience amid growing demands from regulators regarding IT continuity.
Concurrently, sustainable finance products are expanding beyond niche applications into mainstream portfolio segments including social housing loans underpinning national infrastructure goals combined with green-linked lending routines requiring specific tracking/verification enhancing transparency for investors—a crucial factor elevating NatWest’s competitive standing in both public sector interfacing and private institutional mandates [S1,N2].
Outlook Indicators: Monitoring Critical Upcoming Milestones
Absent explicit forward-looking numerical guidance beyond share buyback sizing disclosed recently, stakeholders should monitor several key indicators:
- Cost-to-income ratio trajectory will be telling given rising investment outlays against revenue growth pressures;
- Loan impairment trends especially on residential mortgages warrant scrutiny due to sensitivity to interest rate & property market dynamics;
- CET1 ratio evolution through upcoming regulatory reviews including post-BCST buffer recalibrations;
- Outcomes of advanced climate change scenario tests for credit portfolios that could drive capital reclassification or provisioning adjustments;
- Execution pace on digital platform enhancement milestones aligned with AI deployments.
These factors collectively represent focal points defining NatWest’s ability to sustain balanced growth while complying tightly with prudential regulations [N1,S1].
Shareholder Returns: Buybacks, Dividends, and ROE Analysis
NatWest’s commitment to shareholder value is apparent through active share repurchases totaling up to £750 million authorized recently consistent with prior buybacks completed last year totaling similar amounts averaging around mid-500 pence per share executed primarily through third-party agents (UBS AG) under autonomous trading programs ensuring market best-effort execution without undue price support distortions [S2,S3,S4,S19].
ROE improvement from mid-teens levels toward near-14% reflects successful earnings quality recovery post-pandemic alongside disciplined capital stewardship limiting excess dilution given equity accretion through retained earnings over expanding balance sheets.
Dividends details remain sparse but are presumed aligned with PRA MDA rules that restrict distributions below set CET1 thresholds ensuring cautious payout frameworks underpinned by strong liquidity ratios currently maintained [S6,S9]. This strategy mirrors typical UK large bank practice emphasizing gradual capital build while providing some level of recurring owner returns.
This analysis summarizes publicly reported data alongside contextual industry knowledge specific to NatWest Group plc as filed through early 2026 SEC disclosures including Form 20-F annual statements complemented by Form 6-K interim updates without extrapolated or speculative figures beyond available source information. Readers should consider emerging macro-financial conditions as well as regulatory developments when assessing the ongoing evolution of NatWest’s business model. No investment advice or recommendation is provided herein.
Disclaimer: This is research-only, informational analysis and not investment advice. It may include AI-generated interpretation and general industry context. Always verify important details using primary sources.
Comments