
VisitIQ Corp. Unveils Strategic Resource Measures in Latest 10-K/A
The company’s amended 2025 annual filing reveals liquidity pressures alongside ongoing financing arrangements critical to sustaining operations.
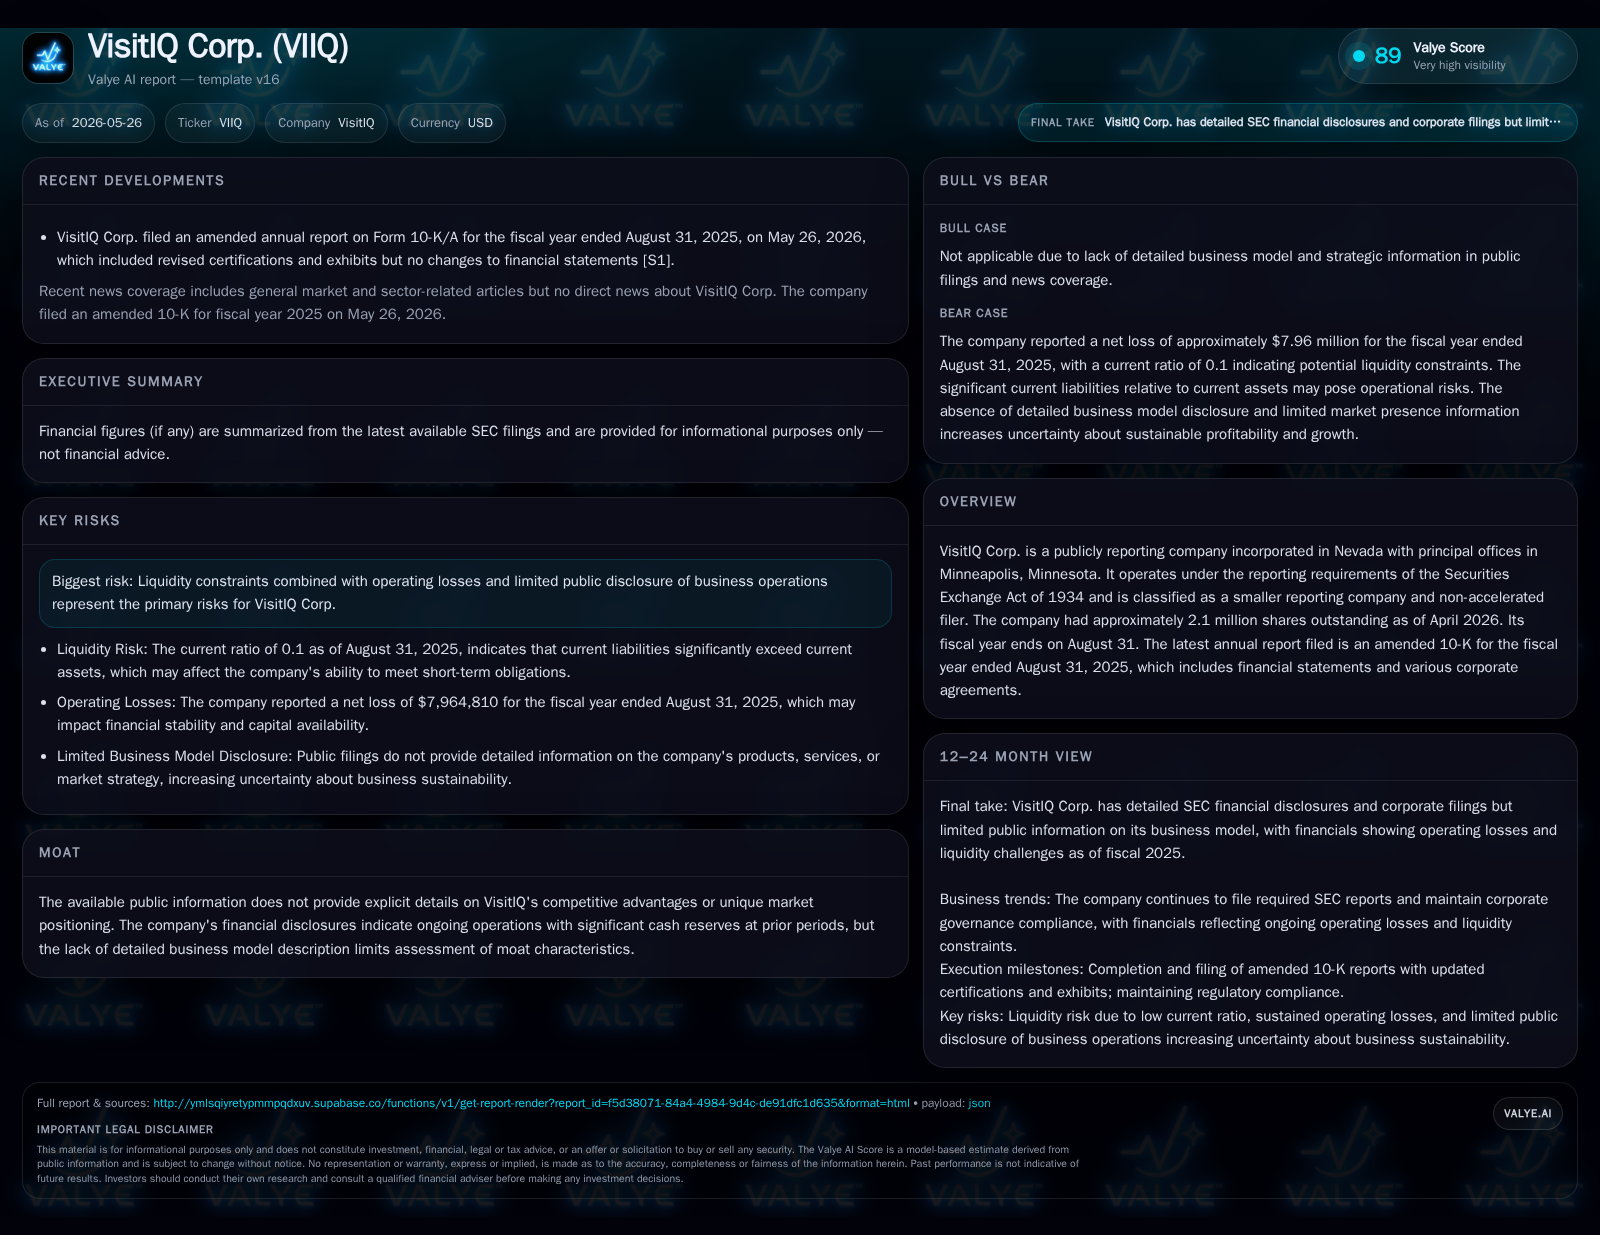
VisitIQ Corp.'s May 2026 amended 10-K highlights significant financial constraints, including a current ratio near 0.1 and operating losses nearing $8 million for fiscal 2025. New loan and security agreements with institutional investors underscore efforts to maintain liquidity amid tight resources. The company's business model remains opaque with modest revenue generation, complicating competitive assessment. Growth prospects appear limited, reliant largely on managing capital structure and potential operational initiatives tied to financing agreements.
Latest Annual Filing: Key Updates and Corporate Changes
VisitIQ Corp.’s May 26, 2026 amended Form 10-K (10-K/A) for the fiscal year ended August 31, 2025, principally serves as an exhibit update to comply with Sarbanes-Oxley attestations without altering previously reported financial figures [S1]. Crucially, the filing details multiple material agreements executed during late fiscal 2025 and early calendar 2026—most notably a November 10, 2025 Note Purchase Agreement with Arena Investors LP and a March 26, 2026 Loan and Security Agreement involving Decathlon Alpha V LP alongside Vernon Hanzlik, the company’s CEO [S1][S7]. These contracts signify active management of VisitIQ’s capital structure amid constrained liquidity.
Further corporate governance documents such as shareholder agreements with Arena Investors also suggest strategic investor involvement influencing operational decisions [S5]. The share count stands at roughly 2.13 million common shares outstanding as of April 2026, indicating modest scale [S1]. These financing arrangements represent the cornerstone of VisitIQ’s near-term ability to operate given its limited internal cash flow generation.
Business Model Assessment: Revenue Streams and Product Offerings
VisitIQ generates revenue from its services/products but provides very limited public detail regarding their exact nature or market application [S1]. Fiscal year 2025 revenue totaled about $2.6 million—a relatively low figure suggesting a niche or early-stage business operation [F1]. Without explicit product descriptions or contract breakdowns in filings, understanding how customers pay (subscription/license fees versus usage-based charges) remains speculative.
Margins appear pressured given substantial operating losses of approximately $8 million during the same period [F1]. This discrepancy points to high fixed costs relative to volume or immature monetization mechanisms. The company’s disclosures do not elaborate on customer concentration, pricing strategy, switching costs, or capacity constraints that might otherwise clarify the strength of its business model [S1].
Consequently, assessing product differentiation or innovation is challenging. The absence of detail imparts opacity around strategic positioning versus competitors and weakens confidence in durable competitive advantages.
Industry Framework: Competitive Dynamics and Market Context
Public data lacks definitive classification of VisitIQ’s sector or peers; hence placing it within an industry value chain requires cautious generalizations. As a smaller reporting company outside large accelerated filer categories, the firm likely occupies a specialized market niche possibly within technology or business services.[S1]
The disclosed lack of competitive moat characteristics—such as network effects, proprietary platforms, or regulatory barriers—suggests vulnerability to rivals with deeper pockets or more scalable offerings. Pricing power also appears limited given persistent operating losses despite sustained revenue inflows. Regulatory oversight impacts seem minimal based on filing content.
Customer adoption dynamics remain unclear without data on contract tenure or renewal rates; similarly, distribution channels are unreported. This opacity challenges benchmarking VisitIQ head-to-head against better-documented competitors but signals that any market leadership claims would be premature.
Growth Drivers: Potential Catalysts and Expansion Paths
VisitIQ's primary growth driver appears linked to navigating its financing environment rather than organic demand expansion [S1][S7]. The infusion of capital via recent note purchase and loan agreements facilitates operational continuity and may fund modest strategic initiatives. Yet no explicit mention exists within filing text about new contracts, product launches, or partnerships that typically propel growth trajectories.
Given revenue scale under $3 million alongside near $8 million losses last fiscal year [F1], internal reinvestment for scaling is likely minimal. Growth may depend heavily on successful leveraging of new capital arrangements to stabilize finances before meaningful expansion can occur.
Absent further clarity from management disclosures beyond the latest annual report, catalysts remain intangible—with improvement contingent upon execution against financial obligations and possibly enhanced commercial activity.
Risks and Constraints: Financial, Operational, and Disclosure Challenges
The foremost risks confronting VisitIQ cluster around liquidity fragility coupled with structural operating deficits [F1]. The firm reports current assets around $413 thousand offset by current liabilities exceeding $4.16 million at August 31, 2025—a current ratio roughly equal to 0.1—highlighting urgent short-term funding challenges [F1].
Total debt stands at an estimated $11.15 million (from earlier periods but still indicative), indicating leverage pressure consistent with ongoing negative free cash flow dynamics [F1]. Operating cash flow was deeply negative at approximately -$2.62 million in FY25 further extending runway concerns.
Operationally, absence of transparent product/service disclosures magnifies uncertainty regarding sustainable competitive positioning or scalability prospects [S1]. This opacity complicates external evaluations and increases regulatory disclosure risks.
Substantial net losses (~$7.96 million) underline difficulties generating profits absent either robust revenue growth or cost rationalization—a dual challenge exacerbated by capital structure constraints.
Consequently, financial insolvency risk remains a tangible watchpoint unless management achieves refinancing success or operational turnaround.
Monitoring Horizon: Upcoming Milestones and Investor Focus Points
The calendar through forthcoming quarters should be scrutinized for updates on compliance under the newly minted loan/security agreements executed in early FY26 period [S7]. These include deadlines related to debt service obligations under notes purchased from Arena Investors and loan covenants tied to Decathlon Alpha V participation.
Other key milestones involve potential amendments to shareholder agreements which might impact governance dynamics given Arena Investors’ evident role as significant stakeholder via multiple contractual arrangements concluded since late FY24 continuing into FY25 [S5][S7].
Investors should also monitor any forthcoming disclosures clarifying business model nuances or strategic direction shifts that may alleviate historical transparency deficiencies seen across filings.
Overall execution around managing liquidity pressures marks the pivotal performance axis for VisitIQ during this period.
Financial Overview: Summary of Historical Results and Capital Structure
Historical performance (annual)
Capital returns and efficiency (annual)
- Note: Debt figure from earlier period but last known reliable estimate [F1]
Significantly stretched liquidity manifested through a current ratio gravitating around one-tenth underscores inability to meet near-term obligations via current assets alone thus forcing reliance on extended credit facilities recently formalized with institutional lenders [F1][S7]
This capital-intensive profile combined with leveraged balance sheet positions VisitIQ precariously without stronger cash generation capability or evident operational scale enabling margin improvement shortly.
This analysis is based solely on publicly filed SEC documents as of May 26, 2026, companyfacts numeric data available at that date, and standardized industry context without speculation beyond cited sources. It does not constitute investment advice.
Disclaimer: This is research-only, informational analysis and not investment advice. It may include AI-generated interpretation and general industry context. Always verify important details using primary sources.

Comments