
Digital Turbine Harnesses On Device and App Growth Segments in Q3 Review
Q3 2026 operational disclosures spotlight Digital Turbine’s integrated mobile growth platform performance amid pivotal refinancing developments.
Digital Turbine’s latest Q3 filing reveals continued momentum across its On Device Solutions and App Growth Platform segments, underpinned by proprietary technology facilitating app discovery and monetization. The company’s refinancing activities through its August 2025 Financing Agreement and subsequent covenant adjustments shape near-term financial flexibility. While entrenched carrier and OEM partnerships support durable revenue streams, concentration risks and intense market competition persist. Key growth drivers include expansion of native content media placements, SingleTap® efficiency gains, and scaling advertiser demand-side platform capabilities. Refinancing execution and contract renewals will be critical short-term milestones to watch.
Q3 2026 Operating Update: Key Developments from Latest Filing
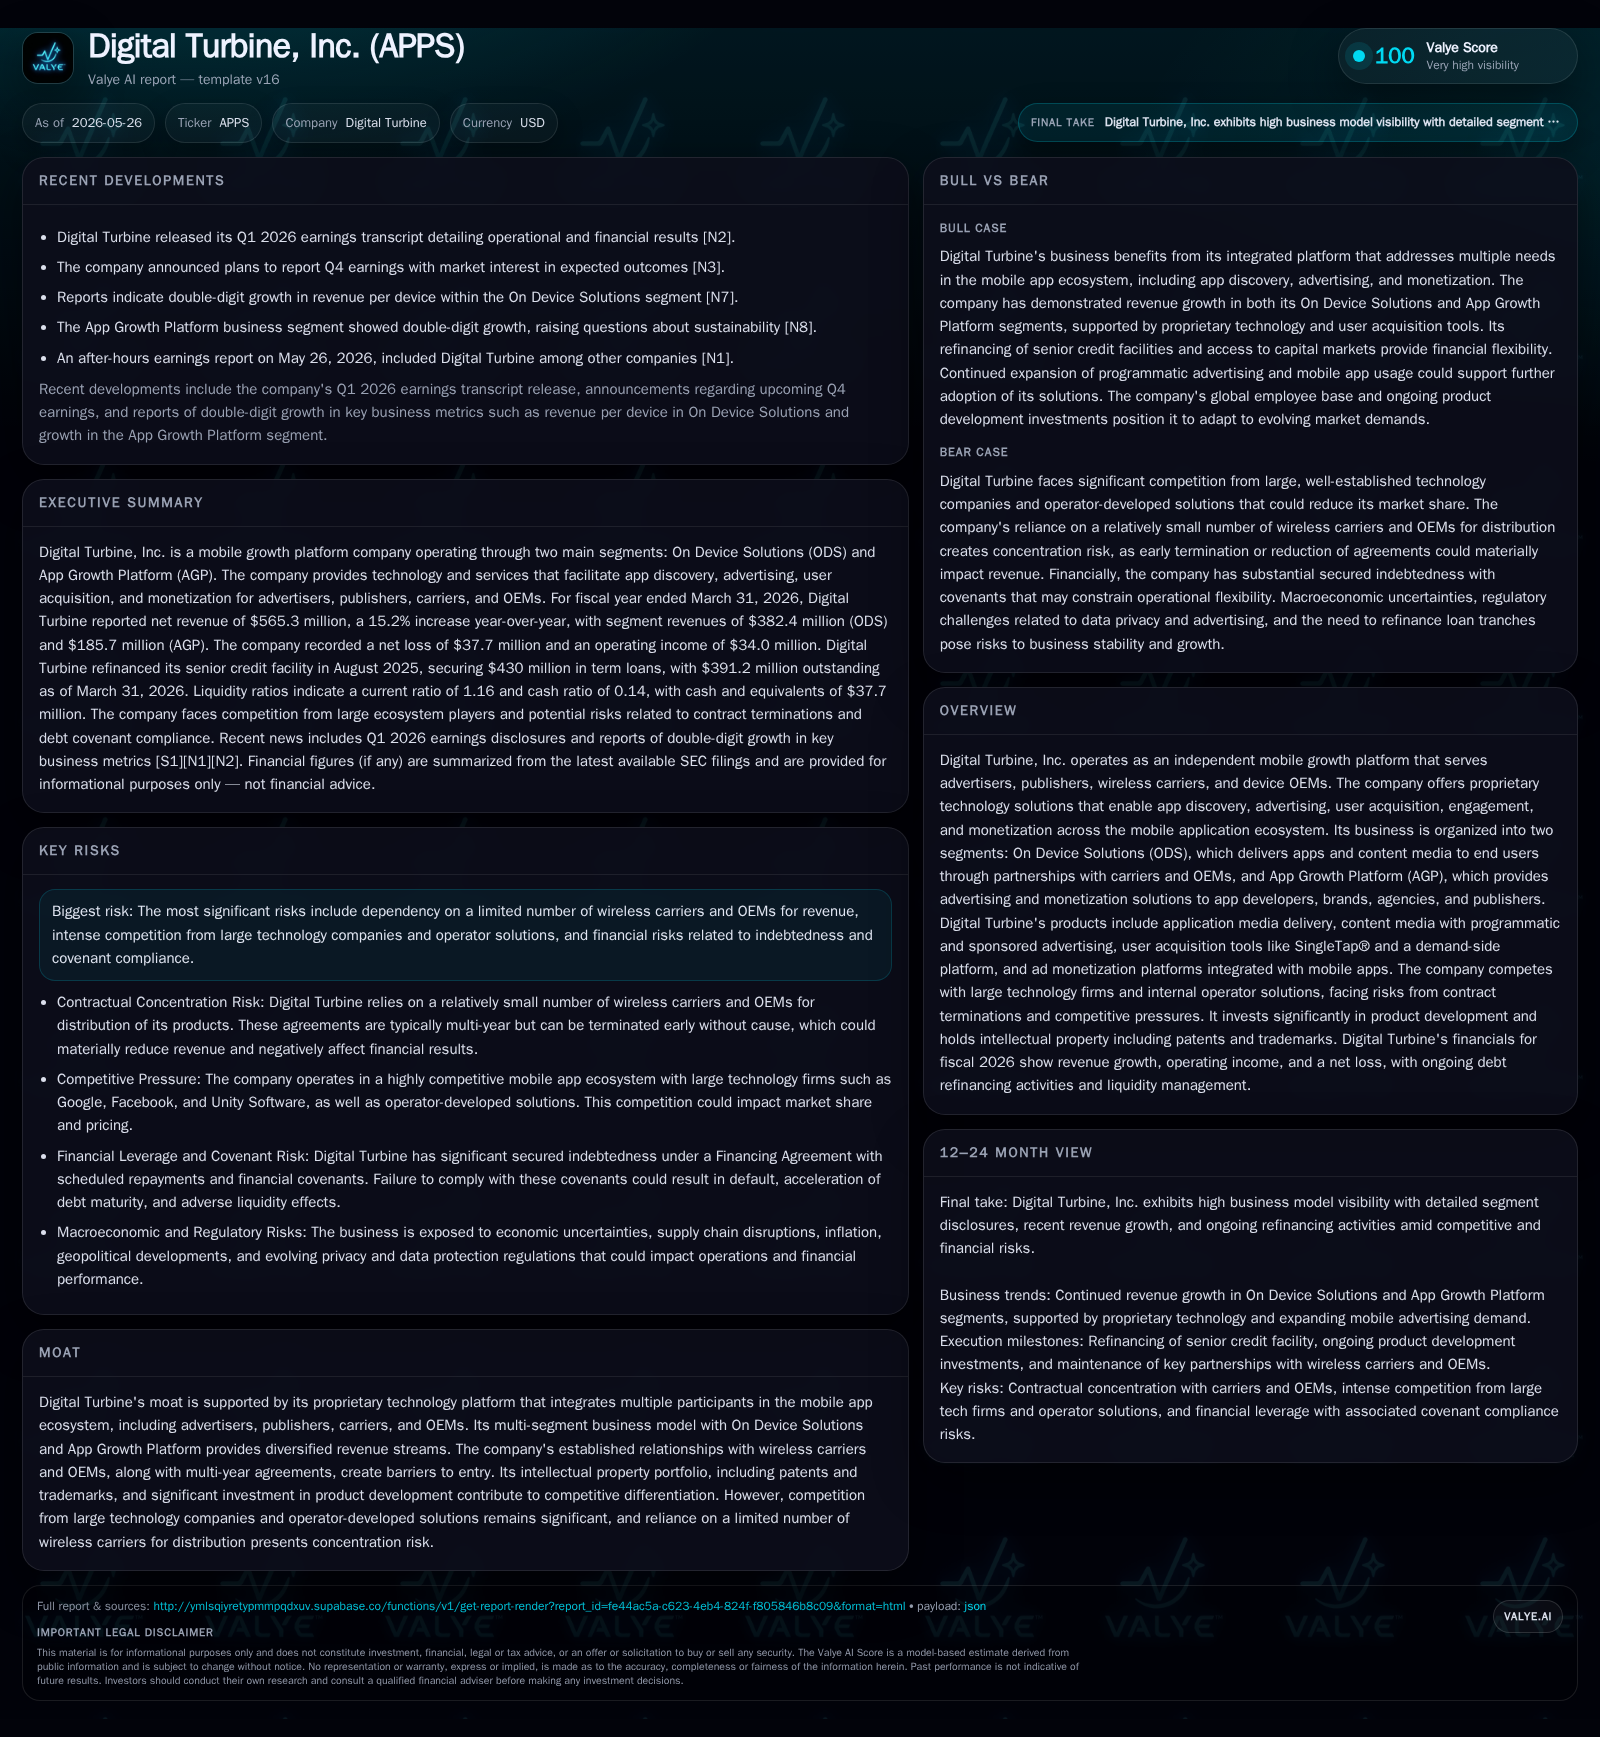
Digital Turbine's Q3 fiscal 2026 filing on February 3, 2026 [S2] alongside the May 26 event filing detailing recent operational highlights [S3] serve as the primary lens into the company’s current performance trajectory. For the fiscal year ended March 31, 2026, Digital Turbine reported net revenues totaling $565 million—a notable increase versus prior periods—composed primarily of contributions from its On Device Solutions (ODS) and App Growth Platform (AGP) segments [S26]. The ODS segment generated approximately $382 million in revenues while AGP accounted for roughly $186 million after revenue eliminations—both reflecting expansion over prior comparable periods [S13]. Segment profits rose accordingly to $321 million combined.
Operationally significant is Digital Turbine's August 29, 2025 refinancing that replaced its prior credit facility with a new four-year Financing Agreement structured across three term loan tranches totaling $430 million [S1]. All loans were drawn immediately on closing; since then the company has repaid one tranche partially using proceeds from an At-the-Market (ATM) equity offering which raised about $58 million during fiscal year ended March 31, 2026 [S7, S20].
Digital Turbine Business Model and Product Overview
Digital Turbine operates at the intersection of advertisers, app publishers/developers, wireless carriers, and device OEMs within the mobile app ecosystem—a complex multi-party environment it addresses through proprietary technology platforms enabling app discovery, delivery, user acquisition, engagement, and monetization [S1].
The company's two operated segments exemplify integrated parts of this ecosystem:
On Device Solutions (ODS): This business delivers apps and content media directly onto users' mobile devices via partnerships with carriers and OEMs. Revenues primarily derive from a revenue share model where Digital Turbine markets premium application slots or advertising inventory to third-party publishers or advertisers. ODS includes two subdivisions:
- Application Media: Uses proprietary technology to optimize app installs by streamlining demand management across developer clients. The integration into native device firmware or carrier UI allows seamless app delivery systems.
- Content Media: Presents editorial or sponsored content such as news or weather within native contexts—lock screens, start pages—or dedicated widgets. Monetization here leverages programmatic CPM ads sold on exchanges plus CPC-based sponsored editorial content clicks.
The ODS revenue mechanics hinge on volume of app installs or ad views/clicks delivered through numerous publisher relationships combined with pricing dynamics shaped by real-time bidding marketplaces or direct guaranteed campaigns [S1]. Revenue shares paid out to carriers/OEMs appear as cost of revenue expenses on Digital Turbine's books
App Growth Platform (AGP): Geared towards advertisers—app developers plus brands/agencies—this segment offers targeted campaign execution services enabling user acquisition at scale. Critical product features include:
- SingleTap® User Acquisition Tools: Removing friction barriers inherent in typical install flows by enabling one-touch app installation within ads enhances conversion rates significantly.
- Demand-Side Platform (DT DSP): Provides programmatic buying access leveraging direct relationships with mobile publishers granting exclusive inventory.
Here revenues come largely from advertising budgets spent on acquiring users or engaging audiences via display/native/video ads. Pricing structures blend CPC/CPI/CPA models tuned for client campaign ROI objectives.
This diversified multi-segment approach positions Digital Turbine uniquely as both a distributor deeply integrated at the device/app delivery layer through carriers/OEMs (ODS) while simultaneously capturing demand-side spend through AGP advertising technology products serving developers/brands directly.
Industry Positioning and Competitive Context in Mobile Ecosystem
As an independent platform unbundled from dominant OS owners or telecom operators yet embedded within their device ecosystems via long-standing agreements—with some spanning multiple years—Digital Turbine benefits from meaningful switching costs for both carriers/OEM partners and advertisers/publishers relying on its aggregated technology stack [S15]. The firm maintains a robust intellectual property portfolio protecting key innovations in frictionless app installs and multi-channel media delivery integration.
Competitive pressures however remain intense. On the supply side for ODS offerings, Google Play Store predicates a formidable incumbent threat given its default presence on most Android devices. Additionally internal operator-developed solutions or bespoke apps distributed by OEMs may erode addressable inventory accessible solely through third-party platforms like Digital Turbine. On the demand side of AGP advertising solutions competition spans major digital giants including Facebook (Meta), Google Ads ecosystem players—some both customers and competitors—and specialized DSP providers such as The Trade Desk or Unity Software operating in parallel user acquisition verticals [S15].
Peers also include programmatic-focused technology firms like AppLovin and Liftoff that compete on both pricing efficiency and innovation velocity in mobile attribution models.
Growth Drivers: Leveraging Carrier & OEM Partnerships and Platform Innovation
Growth avenues are grounded in expanding the breadth and depth of app/content placements via ODS partnerships along with scaling programmatic footprint within AGP:
- Carrier & OEM Expansion: Adding new wireless carriers or entering additional OEM relationships provides incremental native screen real estate for application slot marketing or content widget embedding thereby boosting available monetizable inventory beyond existing footprint [N2].
- Content Media Scaling: Progressively increasing sponsored content placements in lock screens/browser start pages strengthens programmatic CPM yield streams while editorial media advances click-through monetization opportunities under CPC terms [S1].
- SingleTap® Efficiency Gains: Continuous refinement of single-touch install methodology achieves higher conversion metrics translating into improved user acquisition ROI which drives advertiser budget increases within AGP campaigns [N2].
- DSP & Programmatic Innovation: Enhancements to DT DSP enable better targeting precision/bid optimization for brands/agencies seeking direct access to unique mobile inventory bolstering ARPU per ad impression potentially raising pricing power against competing platforms [N3].
- Cross-Selling Among Segments: Leveraging data intelligence across ODS distribution partnerships allows more tailored audience targeting in AGP campaigns enhancing overall platform stickiness.
Timely execution on onboarding initiatives combined with increasing adoption rates for frictionless install tools mark measurable KPIs signaling sustainable top-line expansion potential.
Risks and Watchpoints: Debt Structure, Carrier Concentration, and Competitive Pressures
Key operational constraints rest upon both external market dependencies and internal financial structuring:
- Customer Concentration: A small set of large wireless carriers represent significant proportions of ODS revenue; should any materially curtail platform use or opt for internally developed solutions this would materially impact revenues given limited substitutable scale currently available elsewhere [S1,S19].
- Financial Leverage & Refinancing Risk: As of March 31, 2026, Digital Turbine had total secured debt of approximately $391 million against cash balances near $38 million, resulting in net debt around $353 million [F1]. Upcoming scheduled repayments linked to Financing Agreement tranches mature through August 2029; refinancing remains an important consideration for sustaining liquidity buffers.
- Competitive Dynamics: Persistent competition by much larger tech entities owning dominant OS ecosystems (Google/Apple), expansive ad sales arms (Meta), plus newer operator-built solutions require continual investment in R&D innovation particularly around user acquisition efficiency and exclusive supply chain integrations which can pressure margins long term if scale advantages erode [S15,S28].
- Host Agreements & Commitments: Multi-year hosting contracts producing minimum purchase commitments exceeding $192M through FY2030 create fixed operating cost layers requiring consistent revenue coverage to avoid margin compression under adverse market scenarios
What to Monitor Next: Guidance, Market Trends, and Execution Milestones
Near-term developments critical for gauging trajectory include:
- Updated Q4 FY26 revenue guidance signals reflecting success or softness in campaign volume traction across AGP channels plus incremental content media rollout velocity within ODS partnerships forthcoming from official earnings releases circa mid-Late FY26 reporting window [N2,N3,S3].
- Progress toward refinancing remaining loan tranches under the existing Financing Agreement on favorable terms before maturity dates to mitigate liquidity drain risk alongside possible capital market transactions offering incremental funding optionality.
- Contract renewal outcomes with principal wireless carriers especially regarding exclusivity terms or fee structures influencing future scale ceilings permanently affecting near-term topline stability or share shifts among competitive alternatives in ecosystem deployment scenarios [S19]
- Product development roadmap advancements focusing on SingleTap® functionality improvements promoting user install conversion lift plus enhanced algorithmic optimizations within DT DSP supporting higher yield per impression auctions underpin broad-based advertiser demand elasticity tests feeding future pricing power assumptions [N3]
- Adoption metrics for sponsored content formats embedded natively—measured through click-through/cost-per-click trends—to verify ability to supplement core programmatic CPM revenues sustainably aligned with macro-ad market fluctuations.
Brief Financial Profile: Liquidity, Debt, and Profitability Snapshot
As of fiscal Q3 ending March 31, 2026, Digital Turbine held approximately $37.7 million in cash & equivalents against long-term secured indebtedness totaling about $391 million (gross), netting roughly $353 million net debt positions after accounting for cash balances [F1]. The current ratio stood near a moderate level of about 1.16 implying sufficient near-term liquidity coverage against current liabilities totaling approximately $268 million balanced against current assets near $312 million [F1].
Operating income recorded was positive at roughly $34 million for the trailing twelve-month period ending March 31, 2026, contrasting with a net loss close to $38 million primarily driven by non-operating expenses such as interest costs related to elevated leverage levels [F1,S26]
The company’s financing structure entails scheduled quarterly principal repayments summed around low millions per quarter alongside potential mandatory prepayments tied to equity issuance proceeds or excess cash flow starting FY27 onwards underscoring pressure points in capital allocation going forward [S2,S6]
Commentary strictly avoids investment research views per policy.
Disclaimer: This is research-only, informational analysis and not investment advice. It may include AI-generated interpretation and general industry context. Always verify important details using primary sources.

Comments