
Verisign Secures Growth via .com Pricing Power and Domain Base Expansion in Q1 2026
Verisign’s latest quarter highlights sustained domain registration growth and strategic fee increases under regulatory tenure.
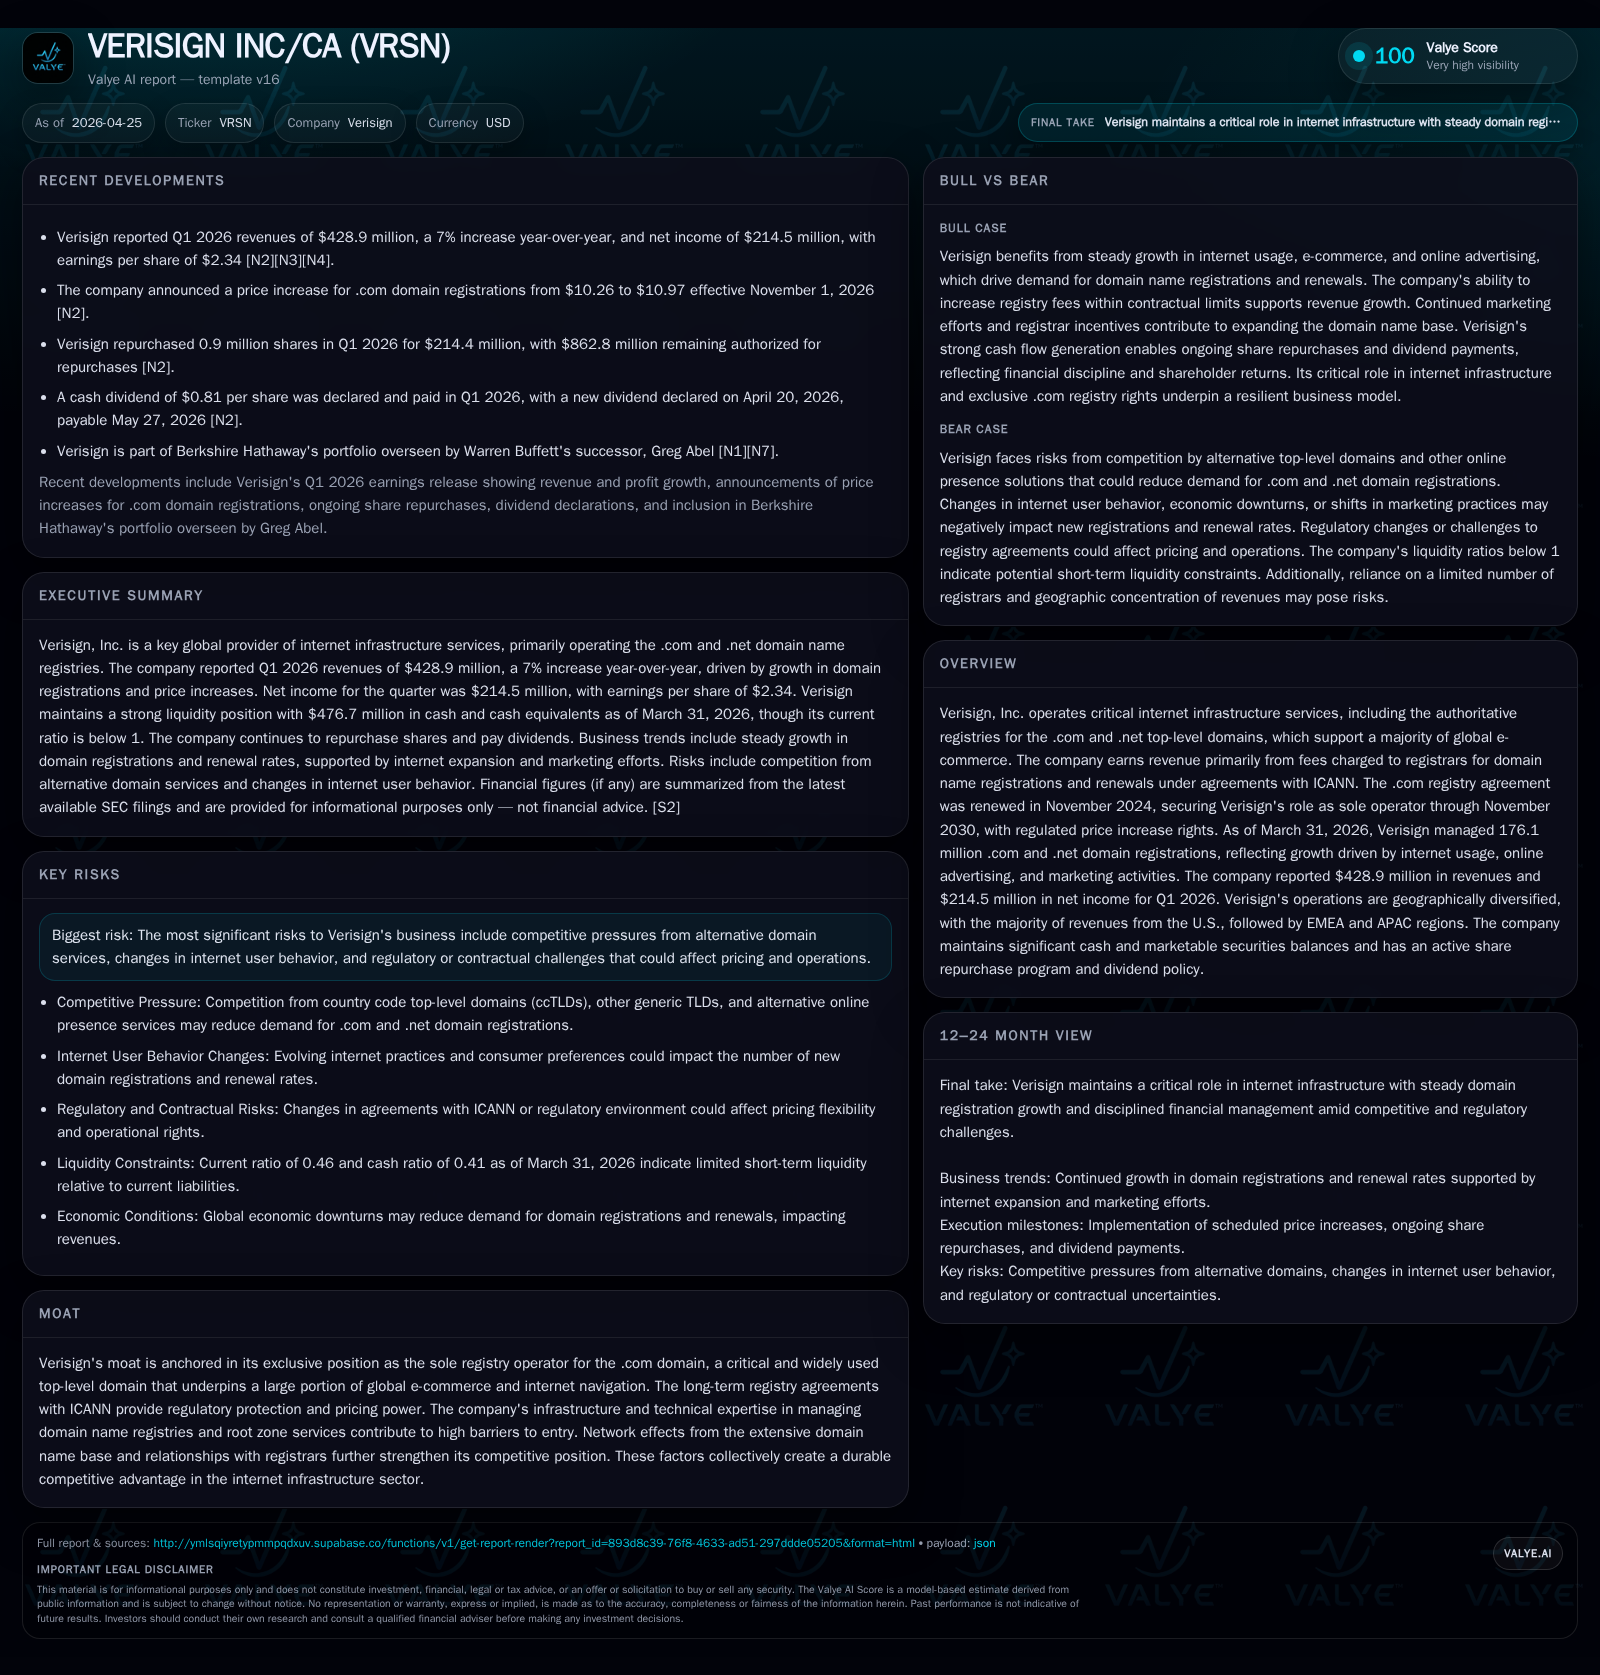
In Q1 2026, Verisign reported a 7% revenue increase primarily driven by a 3.7% growth in its .com and .net domain name base, now at 176.1 million registrations, supported by fee hikes authorized under its renewed ICANN agreements. Operating income expanded 8%, while the company continues aggressive capital returns through dividends and substantial share repurchases. Verisign’s durable moat stems from its exclusive control of critical top-level domains and robust technical infrastructure, though rising costs and competitive pressures persist as watch points.
Recent Operating Update: Q1 2026 Financials Anchor Growth Momentum
Verisign's latest quarterly filing ([S2] 10-Q dated April 23, 2026) reveals a solid Q1 performance underpinning both near-term momentum and longer-term contract-driven stability. Revenues came in at $428.9 million, up 7% from $402.3 million in Q1 2025, driven predominantly by a combination of increased domain registrations and tariff adjustments allowed under the company's ICANN agreements.
Most notably, the active domain name base for.com and.net reached 176.1 million as of March 31, representing a nearly 4% year-over-year expansion from the prior year's comparable figure of approximately 169.8 million ([S2], [S7]). This growth was bolstered by marketing initiatives deployed alongside registrars and favorable shifts in internet usage patterns—particularly the adoption of AI tools for content creation that boost website proliferation.
The company exercised pricing power through an April announcement to raise the wholesale fee for.com registrations from $10.26 to $10.97 effective November 1, reflecting the regulatory latitude provided by its recently renewed agreement through November 2030 ([S22]). Similar annual increases for.net fees were earlier implemented on February 1, 2024.
Operating income surged to $293.6 million (+8%), demonstrating operational leverage amid consistent cost of revenues reported around $49.2 million (-1%) ([S2], [S12]). The slight increase in SG&A expenses—primarily from higher compensation costs—is managed within growth initiatives including R&D investments that rose modestly to $27.5 million (+6%) ([S5]).
A key operational highlight includes processing a record-setting 11.5 million new domain registrations during Q1 versus just over 10 million in the previous year period—indicating robust underlying demand despite broader economic uncertainties ([S12]). Renewal rates held steady with a final fourth-quarter rate of roughly 75%, evidencing solid customer retention dynamics.
Business Model: Exclusive Registry Operator for Critical TLDs
Verisign’s earnings derive almost entirely from its role as sole registry operator for the globally dominant.com and.net generic top-level domains (gTLDs). Under long-term cooperative agreements with ICANN—the Internet Corporation for Assigned Names and Numbers—Verisign earns wholesale fees on each new registration and renewal processed through accredited registrars who interact directly with end users.
The business model benefits structurally from multiple sources:
- Contractual Exclusivity: The.com Registry Agreement extension signed in November 2024 secures Verisign’s monopoly until at least November 2030 with prescribed pricing ceilings allowing annual percentage-based fee increases,
- Volume Leverage: Domain registrations grow organically alongside expanding internet penetration, e-commerce activity, brand marketing efforts requiring digital presence, and emerging technologies like AI-enhanced content generation,
- Ecosystem Entrenchment: Network effects accumulate as millions of registered domains promote continued registrar engagement and user reliance on Verisign-managed infrastructure,
- Operational Expertise: The technical complexity of managing the authoritative root zone servers and registry databases creates high entry barriers that effectively shield Verisign from commoditization.
Revenue is predominantly billed in U.S. dollars globally, minimizing currency risk exposure ([S2]). While the firm operates internationally with registrars across the U.S., EMEA, APAC, and other regions providing geographic diversification ([S17]), its fundamental revenue dependency remains tightly linked to registration volumes under these two core domains.
Industry Structure and Competitive Position
The domain name registry industry is marked by significant regulatory oversight due to the critical nature of internet namespace stability. Verisign sits atop this hierarchy as one of only thirteen root zone operators worldwide but uniquely controls the oversized share stemming from the ubiquity of.com (the most recognized global TLD) together with legacy rights over.net.
Competition arises mainly from alternative gTLDs (e.g.,.org,.info), country-code TLDs (ccTLDs), and emergent internet identity services offering substitutes or complements to traditional DNS-based naming structures. However, no alternative replicates.com's brand cachet or universal acceptance critical to global commerce.
ICANN-led auction attempts like those involving Altanovo Domains Limited illustrate periodic contestation within governance rules but have yet failed to dislodge incumbency due primarily to technical performance capabilities and contractual protections ([S18]).
Nonetheless, shifts in consumer behavior such as migration toward social media handles or app ecosystems could influence long-term demand dynamics; Verisign remains vigilant on these fronts alongside broader cyber policy developments ([S18]).
Growth Drivers and Constraints
Drivers:
- Continued global internet user growth fueled by expanding broadband access,
- Rising e-commerce adoption incentivizing brand owners’ online presence investment,
- Enhanced registrar marketing efforts supported by Verisign promotional programs,
- Incremental pricing power guaranteed by multiyear ICANN agreements permitting regulated fee increases up to specified percentages annually,
- Adoption of AI tools lowering friction for website creation encouraging domain name demand.
Constraints:
- Competitive pressures from alternative TLDs offering niche or lower-cost options,
- Potential disruptions from novel digital identification mechanisms diminishing relevance of DNS,
- Regulatory scrutiny circumscribing price hike aggressiveness or contract terms,
- Macroeconomic factors affecting discretionary marketing budgets impacting new registrations,
- Customer behaviors emphasizing domain portfolio monetization or consolidation rather than expansion.
Verisign’s ability to offset these constraints relies heavily on maintaining superior technical resilience coupled with proactive registrar partnerships encouraging domain renewals—a generally sticky customer base given associated switching costs such as SEO impact preservation ([S12]).
What to Watch Next
Key upcoming milestones include:
- Implementation of the announced November 1st price increase for.com domain registrations which could further lift revenues if uptake sustains;
- Continued monitoring of renewal rates beyond Q4 2025’s ~75%, since retention trends constitute critical revenue stability markers;
- Domain registration volume trajectory amidst any shifts in registrar marketing strategies or competitive evolutions;
- Legal outcomes related to ongoing Independent Review Processes involving ICANN disputes which may affect future contract landscapes ([S18]);
- R&D developments particularly focused on enhancing registry security against cyber threats ensuring ongoing infrastructure trustworthiness;
- Execution effectiveness on share repurchase programs (with $862.8 million capacity remaining) guiding shareholder return signals onboard management priorities ([S8], [S15]);
- Macro internet usage trends influenced by emerging technology rollouts potentially altering domain naming demand secular trends.
Financial Profile: Robust Cash Generation Fuels Capital Returns Amid Cost Investment
Historical performance (annual)
|
| FY | Rev ($mm) | Net ($mm) | CFO ($mm) | OpInc ($mm) | Rev YoY | Net YoY |
|---|---|---|---|---|---|---|
| 2026 | 215 | -74.0% | ||||
| 2025 | 1657 | 826 | 1091 | 1121 | +6.4% | +5.1% |
| 2024 | 1557 | 786 | 903 | 1058 | +4.3% | |
| 2023 | 1493 | 854 | 1001 | +4.8% |
Source: SEC companyfacts cache [F1].
Capital returns and efficiency (annual)
|
| FY | Buybacks ($mm) | FCF ($mm) | ROE% |
|---|---|---|---|
| 2026 | |||
| 2025 | 882 | 1068 | -38.3 |
| 2024 | 1226 | 875 | -40.1 |
| 2023 | 901 | 808 |
Source: SEC companyfacts cache [F1].
Verisign boasts exceptionally strong cash generation ability rooted in its oligopolistic domain registry franchise.
|
| FY | Revenue ($B) | OpInc ($B) | Net Income ($M) | CFO ($B) | Capex ($M) | Dividends Paid ($M) | Buybacks ($M) | Rev YoY % | OpInc YoY % |
|---|---|---|---|---|---|---|---|---|---|
| 2025 | 1.656 | 1.121 | 826 | 1.091 | 22.8 | 71 | 882 | 6.4% | 5.9% |
For Q1 ended March 31, 2026 specifically:
- Net income stood at $214.5 million vs. $199.3 million year ago (+7%),
- Operating expenses grew moderately in SG&A due to compensation inflation but remained well-covered by revenue gains ([S5], [S16]),
- Cash & cash equivalents reached $476.7 million as of quarter-end with no debt outstanding, indicating a strong liquidity position ([F1]),
- Share repurchases continued aggressively with nearly one million shares bought back during the quarter for over $214 million reflecting shareholder-friendly capital allocation policy ([S4], [S15]),
- Dividends maintained at $0.81 per share with recent declaration supporting steady income stream commitment ([S29]).
Capital expenditure remains low relative to free cash flow underpinning efficient asset deployment mostly aimed at technical infrastructure upgrades rather than heavy capex cycles.
Overall financial flexibility supports sustainable dividend payouts alongside opportunistic buybacks without undue balance-sheet leverage—a hallmark characteristic befitting Verisign’s premium asset profile.
Disclaimer: This analysis is for informational purposes only and does not constitute investment advice or recommendations.
Disclaimer: This is research-only, informational analysis and not investment advice. It may include AI-generated interpretation and general industry context. Always verify important details using primary sources.
Comments