
Wells Fargo's Strategic Scale and Regulatory Complexity Shape Q2 2026 Performance
Wells Fargo's latest quarterly results reflect ongoing calibration of its diversified banking operations under heightened regulatory oversight.
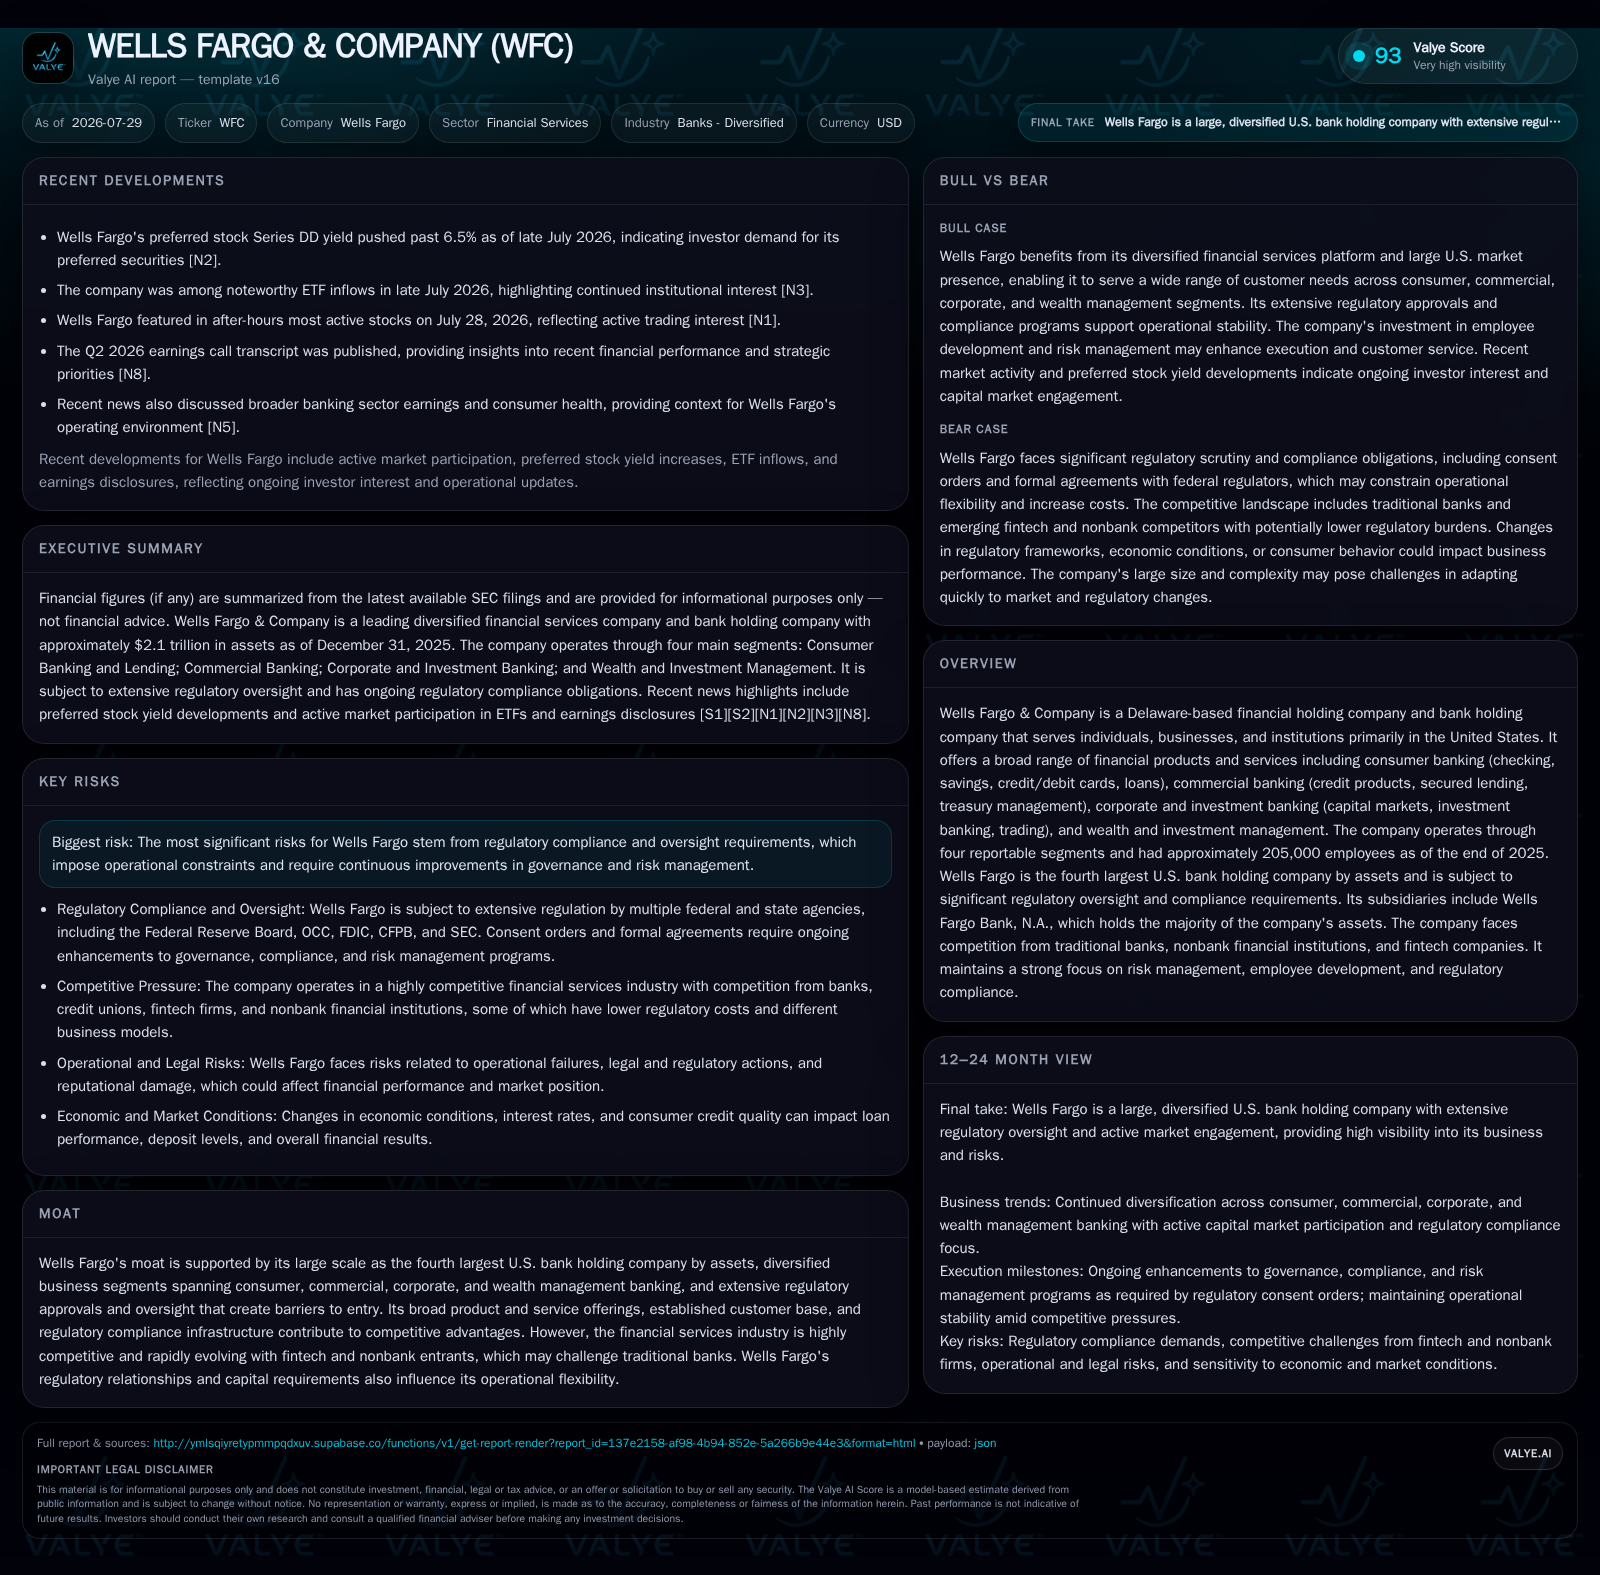
In Q2 2026, Wells Fargo & Company continued leveraging its position as the fourth largest U.S. bank holding company, balancing growth in core banking segments with regulatory compliance constraints. The company’s broad product mix covering consumer, commercial, corporate, and wealth management banking remains a critical competitive advantage but requires careful navigation of capital and liquidity regulations. Rising interest rates have modestly supported net interest margins, while fee income from wealth and investment management offers diversification. However, operational risks linked to compliance and evolving fintech competition remain significant watchpoints.
Recent Operating Update: Q2 2026 Highlights
Importantly, regulatory oversight continues to frame operational flexibility. The Federal Reserve Board’s prior asset growth limitations were lifted as of mid-2025 following governance improvements, yet ongoing consent orders still require enhanced risk controls and compliance investments [S7]. This dynamic was reiterated in Q2 filings acknowledging regulatory mandates as a material factor shaping capital deployment choices.
Business Model: Multi-Segment Diversification Anchored in Scale
Wells Fargo’s business model centers on serving retail customers, businesses, institutions, and high-net-worth individuals through a suite of financial products spanning consumer deposits, lending (home mortgages, auto loans, personal credit), commercial finance (secured lending, treasury management), corporate/investment banking (capital markets access, trading), and wealth services (financial planning, brokerage) [S1][S6]. Revenue mechanics rely heavily on net interest income generated through lending activities funded by deposits. This interest spread is complemented by fee income from wealth advisory services, treasury management fees charged to commercial clients, and investment banking commissions.
The company's deposit base forms a cost-effective funding source supporting loan portfolio expansion; thus deposit growth trends directly impact net interest margin potential. Fee-based businesses provide diversifying non-interest income streams enhancing operating leverage when scaled appropriately [S1]. Strategic strength lies in breadth—no single customer category dominates profitability—mitigating concentration risks but requiring complex operational governance.
This integrated franchise benefits from scale economies evident in staffing (205,000 employees mainly US-based) and extensive branch/digital distribution infrastructure sustaining customer acquisition channels [S6]. However, operating such a vast system entails significant compliance burdens given rigorous U.S. banking regulations across subsidiaries overseen by multiple agencies including OCC, CFPB, FRB, SEC among others [S7].
Industry Structure and Competitive Position
Peers like JPMorgan Chase lead with unmatched investment banking reach while Bank of America leverages retail scale with robust wealth management platforms; Citigroup pursues global corporate exposure whereas Goldman Sachs is specialized toward trading/investment banking with minimal retail footprint. Wells Fargo sits somewhat between these by maintaining balanced exposure across segments but faces challenges growing market share where digital penetration favors more agile or tech-focused competitors blending fintech capabilities with banking services.
Additionally, emerging fintech lenders impose margin pressure particularly in consumer lending segments due to lower cost structures and faster underwriting technology—pressuring traditional banks to accelerate digital transformation initiatives while managing legacy compliance frameworks [S24][N2]
Growth Drivers
Economic fundamentals remain supportive of loan demand growth at Wells Fargo albeit tempered by cautious underwriting standards implemented post-financial crises. Rising U.S. interest rates have helped improve net interest margins after periods of compression caused by historically low yields. This rate environment aids profitability but also increases risks linked to borrower credit quality if rate hikes slow economic activity.
Non-interest income expansion through wealth management fees evidences secular trends tied to demographic shifts—with older populations increasing demand for retirement planning—and sporadic capital markets activity driving investment banking revenues during robust IPO or M&A cycles. Treasury services for commercial clients support stable fee income tied to transaction volumes.
Digital banking adoption improves customer engagement particularly among younger cohorts enabling cross-selling of products more efficiently via integrated platforms—a strategic priority that supports loan/deposit portfolio quality by fostering customer loyalty within Wells Fargo’s ecosystem [N2]. Further regulatory relaxation around control enhancements could unlock share repurchase or dividend flow increases supporting investor returns over time.
Risks and Watchpoints
Regulatory compliance remains the most salient risk axis given Wells Fargo’s history with enforcement actions mandating continuous remediation investments impacting operating expenses negatively while limiting certain business activities or asset expansions until deemed compliant by regulators [S7]. Additionally, this includes restrictions embedded in support agreements among Wells Fargo Parent entities designed to maintain subsidiary liquidity during stress which could curtail parent-level dividends or share repurchases if triggered [S4][S27].
Credit risks persist amid cyclical uncertainties; any economic slowdown could increase loan loss provisions hurting earnings quality despite already conservative underwriting postures [N1][N2]. Operational risks including cybersecurity threats add complexity in retaining consumer trust vital for revenue stability.
Competitive threats escalate from nimble fintech lenders introducing alternative lending models or payment innovations potentially eroding deposit bases or gaining unsecured consumer loan market share absent legacy cost structures or regulatory encumbrances common to large bank incumbents.
What To Watch Next
Key milestones include upcoming quarterly earnings releases that should update trends in loan/deposit growth trajectories amid macroeconomic shifts alongside granular disclosure on net interest margin performance aligned with prevailing rate curve movements. Regulatory developments from FRB or OCC affecting capital adequacy definitions or stress testing protocols will influence capital strategy decisions including dividend policy feasibility.
Monitoring non-interest income trends related to fee-generating segments like wealth management is critical to assess diversification success beyond core lending activities [N2]. Also watch for announcements around digital platform enhancements or partnerships addressing fintech competition dynamics explicitly shared by management during investor calls
Finally, any evolution in consent order status or adjustments in support agreement terms could materially affect free cash flow availability thereby altering shareholder return optics.
Financial Profile Discussion
Capital ratios such as CET1 are rigorously maintained above mandated thresholds enforced by the Federal Reserve’s stress-testing requirements alongside supplementary leverage ratios constraining excessive borrowing relative to equity cushions [S11][S12]. These metrics confirm Wells Fargo’s ability to absorb losses while sustaining operational continuity under adverse scenarios — a critical factor supporting investor confidence.
Liquidity coverage ratios comply with stringent rules ensuring adequate high-quality liquid assets to meet short-term obligations even under stress conditions—a regulatory focal point that affects treasury operations efficiency but fortifies resilience structural integrity [S12]
Dividend policy remains linked closely to both earnings generation capacity—anchored primarily in net interest income—and supervisory approvals reflective of internal capital assessments coupled with external regulatory reviews interconnected through the company’s living will planning obligations designed to assure orderly resolution capability without taxpayer bailouts [S8][S28]
Disclaimer
This analysis is intended for informational purposes only with no investment advice offered herein. It synthesizes publicly disclosed data interpreted within an industry framework unique to large diversified U.S. banks like Wells Fargo & Company.
Disclaimer: This is research-only, informational analysis and not investment advice. It may include AI-generated interpretation and general industry context. Always verify important details using primary sources.

Comments