
Westlake Corp Confronts Earnings Pressure Amid Strategic Reshaping
Westlake's Q1 2026 results reflect ongoing margin headwinds and restructuring costs, testing its vertically integrated business amid volatile market conditions.
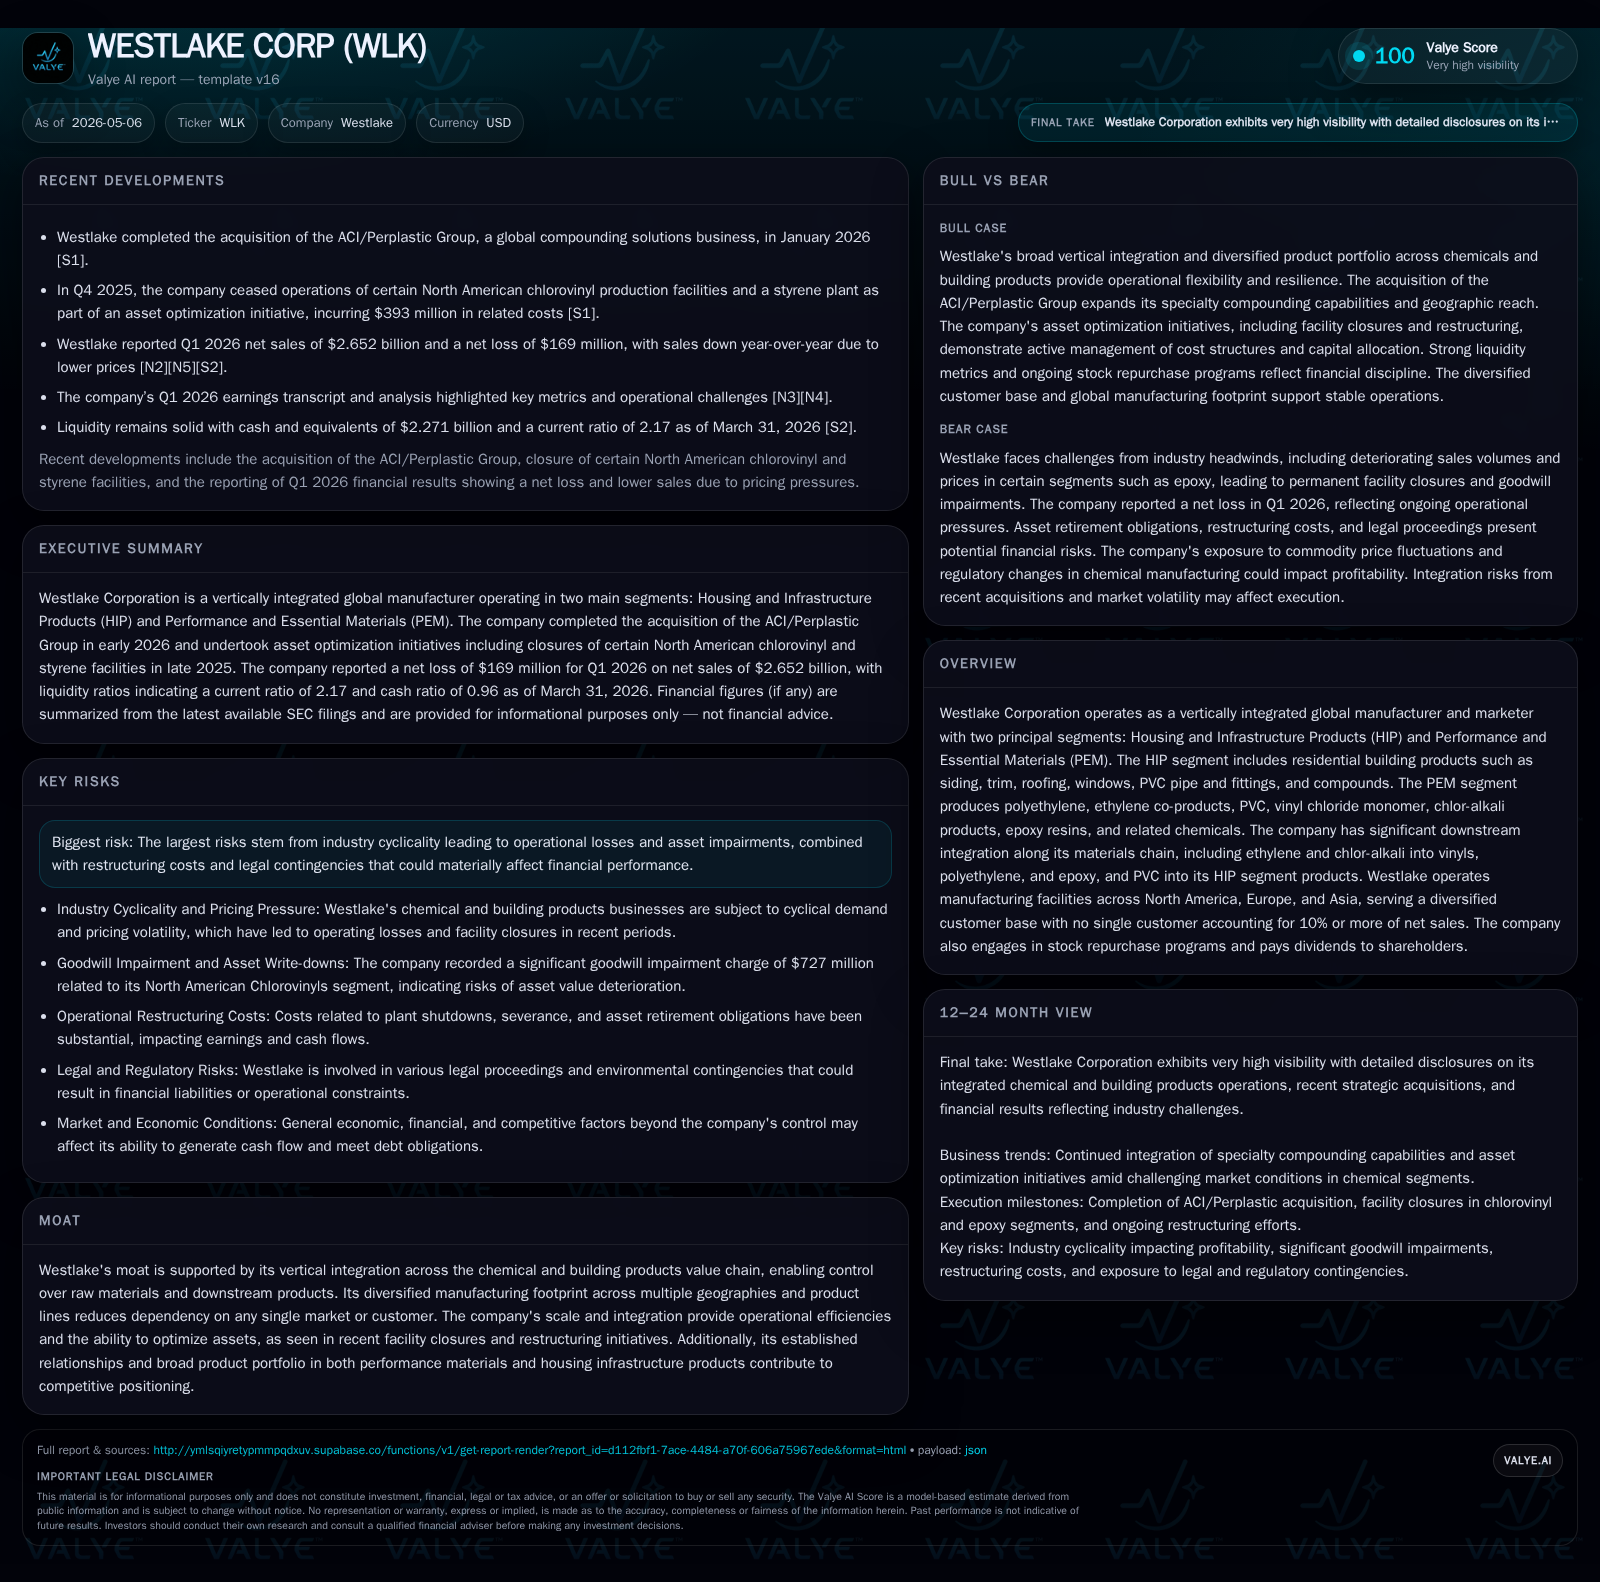
In Q1 2026, Westlake Corporation reported softer sales driven by price reductions and a net operating loss primarily in the Performance and Essential Materials (PEM) segment. The company continues to reshape its asset base with recent North American chlorovinyl facility closures and the acquisition of ACI to expand specialty compounds. These near-term pressures underscore the cyclical challenges in commodity chemicals, while Westlake’s vertical integration offers operational resilience. Maintaining ample liquidity and a stable capital structure supports ongoing strategic initiatives despite earnings pressure.
Q1 2026 Operating Update: Results and Immediate Implications
Westlake Corporation’s first-quarter results filed in the May 6, 2026 10-Q reveal persistent top-line softness coupled with operating losses exacerbated by cyclical challenges in its Performance and Essential Materials (PEM) segment [S2]. The company recorded a notable year-over-year decline in sales driven primarily by lower realized prices reflecting market oversupply pressures in commodity chemicals—a core PEM exposure [N1]. While volumes showed mixed trends, price compression was the dominant factor softening revenues.
One noteworthy balance-sheet signal is the marked increase in contract liabilities—nearly doubling compared to Q1 2025—reflecting timing shifts in performance obligations and revenue recognition patterns under long-term contracts [S2]. At quarter-end, remaining performance obligations stood at $185 million anchored in fixed-price components expected to materialize over upcoming periods. This buildup points to revenue yet to be recognized but also flags potential uneven earnings timing ahead.
The continuing pressure in the PEM segment weighted on operating income as losses deepened from prior quarters. These near-term challenges highlight how commodity cyclicality tightens margin levers despite operational scale advantages. However, offsetting some headwinds are acquisition gains from the recently closed ACI/Perplastic Group deal entered January 2026 that broadens Westlake’s specialty compounds portfolio targeting wire and cable sectors—segments less exposed to commodity volatility [S16].
Westlake's Vertically Integrated Business Model: Strengths and Challenges
Westlake operates two strategic segments: Housing and Infrastructure Products (HIP) and Performance and Essential Materials (PEM), linked via a tightly knit vertical integration model spanning basic petrochemical feedstocks through specialty building products [S1]. Upstream operations convert ethylene and chlor-alkali inputs into vinyls such as PVC which then flow downstream into HIP offerings like siding, roofing materials, piping, and compounded plastics.
This vertical value chain integration affords Westlake enhanced control over raw material sourcing costs alongside flexibility adjusting volumes across product tiers to optimize margins. The HIP segment benefits from steady structural demand tied to residential construction cycles and infrastructure investment, offering diversification away from raw-material-linked cyclicality prevalent at PEM. However, this model introduces complexity balancing throughput across diverse geographies (North America, Europe, Asia) and product characteristics—from commodity chlorovinyls vulnerable to pricing swings to specialty epoxy resins requiring tailored formulations.
The recent acquisition of ACI enhances specialty compound capabilities particularly in global wire and cable markets—growth areas that complement existing compounds at HIP but demand distinct operational competencies [S16]. While vertical integration remains a moat providing supply security and scale benefits, the variety within product sets complicates supply chain agility which is evident during downturns when weaker segments like PEM impose financial drag.
Market Structure and Westlake’s Competitive Footprint
The chemical industry segments Westlake participates in are notably cyclical with margin pressure arising intermittently from overcapacity or feedstock price volatility. The company's manufacturing coverage across multiple continents avoids geographic concentration risks while serving a broad customer base with no single client accounting for more than 10% of net sales—favoring resilience against large account attrition.
Regulatory factors such as ongoing antidumping investigations into epoxy resin imports from Asian countries introduce both opportunity for domestic producers via tariff relief but also legal exposure risk if countervailing duties fluctuate unexpectedly [S1]. Trade policy shifts remain an external uncertainty overlaying underlying market demand dynamics.
Pricing power is constrained particularly within commodity intermediate chemicals where end markets show elasticity; however, downstream building products capture better margin stability linked to construction volume fundamentals rather than feedstock price alone. Thus Westlake’s dual-segment model partially hedges macro swings.
Growth Drivers: Expansion Opportunities and Operational Efficiencies
Key growth catalysts stem from leveraging vertical integration while cultivating specialty product niches with higher entry barriers such as the ACI acquisition which broadens Westlake’s global compounding solutions footprint servicing wire & cable industries with international manufacturing reach in Portugal, Mexico, Tunisia, Romania and assets in China [S16]. This is a strategically relevant expansion targeting less commoditized materials likely producing more stable cash flow profiles.
Additionally, asset optimization efforts including closure of certain underperforming North American chlorovinyls facilities resulted in $393 million recognized restructuring costs mostly non-cash accelerated depreciation charges plus severance obligations executed in late 2025 yet expected to reduce ongoing fixed costs once complete through early 2027 [S1]. These moves emphasize management’s push toward leaner capacity aligned to normalized demand reducing cyclic overhang.
Tax reforms such as those embedded in the One Big Beautiful Bill Act (OBBBA) enable accelerated depreciation incentives facilitating capital expenditure investments aimed at enhancing productivity or environmental compliance—potentially bolstering returns on modernized asset bases [S1].
Despite macro softness weighing on volumes/prices short term, these combined growth vectors from specialty product expansion and cost rationalization create pathways for longer-term margin improvement as legacy excess capacity phases out.
Risks and Constraints: Cyclicality, Restructuring Costs, and Market Pressures
Structural cyclicality represents the largest risk factor—especially manifesting within the PEM segment where commodity chemical pricing follows global supply/demand imbalances that can trigger operating losses or goodwill impairments as previously experienced with a $727 million charge in late 2025 tied to North American Chlorovinyls unit impairment due to sustained industry weakness [S1]. Continued exposure here risks further non-cash write-downs if market conditions deteriorate.
Restructuring costs inflate near-term expenses undermining profitability metrics despite improving fixed cost profiles going forward. Legal contingencies related to antidumping investigations or environmental compliance introduce additional uncertainties although management currently assesses no material adverse effects anticipated from ongoing litigation [S25].
Working capital flexibility could be pressured under volatile input pricing environments given sizable inventory positions linked across multi-stage production processes; effective supply chain management is thus critical during downturns.
Key Upcoming Catalysts and Monitoring Points
Stakeholders should closely monitor second-quarter earnings updates providing clarity on revenue realization from contract liabilities backlog unwind—a leading indicator of organic demand momentum or persisting headwinds [N2][S2]. Progress reports on the completion of plant shutdown-related restructuring obligations will serve as milestones reflecting successful cost containment trajectory.
Raw material input pricing trends particularly ethylene derivatives merit attention since feedstock cost swings immediately impact gross margins at upstream chemical operations influencing downstream pricing pass-through capabilities [N3].
Integration performance of the acquired ACI business including synergy realization timing will also be pivotal as specialty product lines mature within overall portfolio mixes potentially improving average selling prices.
Liquidity, Leverage, and Capital Structure Snapshot
Latest financial snapshot
| Metric | Value | Period |
|---|---|---|
| Cash & equivalents | $2.3bn | |
| 2026-03-31 | ||
| Total debt | $5.7bn | |
| 2026-03-31 | ||
| Net debt | $3.4bn | |
| 2026-03-31 | ||
| Current assets | $6.0bn | |
| 2026-03-31 | ||
| Current liabilities | $2.7bn | |
| 2026-03-31 | ||
| Current ratio | 2.17x | |
| 2026-03-31 |
Source: SEC companyfacts cache [F1].
As of March 31, 2026, Westlake maintains robust liquidity with $2.27 billion cash & cash equivalents alongside available-for-sale securities providing additional financial flexibility [F1][S2]. Total debt sits at approximately $5.66 billion with net debt around $3.39 billion after cash offsetting reflecting moderate leverage given industry volatility context [F1].
A refreshed unsecured revolving credit facility secured on April 2, 2026 extends maturities through April 2031 maintaining $1.5 billion borrowing capacity with attractive covenant packages aligned to current credit ratings underpinning funding stability for ongoing operational needs plus strategic transactions including acquisitions or expansions [S2].
This healthy balance sheet posture supports execution of restructuring programs alongside investment into higher-margin specialty ventures without immediate liquidity stress.
| Metric | Value | As of |
|---|---|---|
| Cash & Cash Equivalents | $2.27 B | |
| 2026-03-31 [F1] | ||
| Total Debt | $5.66 B | |
| 2026-03-31 [F1] | ||
| Net Debt | $3.39 B | |
| 2026-03-31 [F1] | ||
| Current Assets | $5.95 B | |
| 2026-03-31 [F1] | ||
| Current Liabilities | $2.74 B | |
| 2026-03-31 [F1] | ||
| Current Ratio | 2.17 | |
| 2026-03-31 [F1] |
Disclaimer: This analysis is for informational purposes only derived solely from public filings including recent SEC disclosures dated May 6, 2026 ([S2]), company annual reports ([S1]), event filings ([S3]), market transcripts (), and reported financial data ([F1]). It does not constitute investment advice or recommendations.
Disclaimer: This is research-only, informational analysis and not investment advice. It may include AI-generated interpretation and general industry context. Always verify important details using primary sources.
Comments