
Profitability Headwinds and Brand Leverage Define cbdMD’s 2025 Financial Trajectory
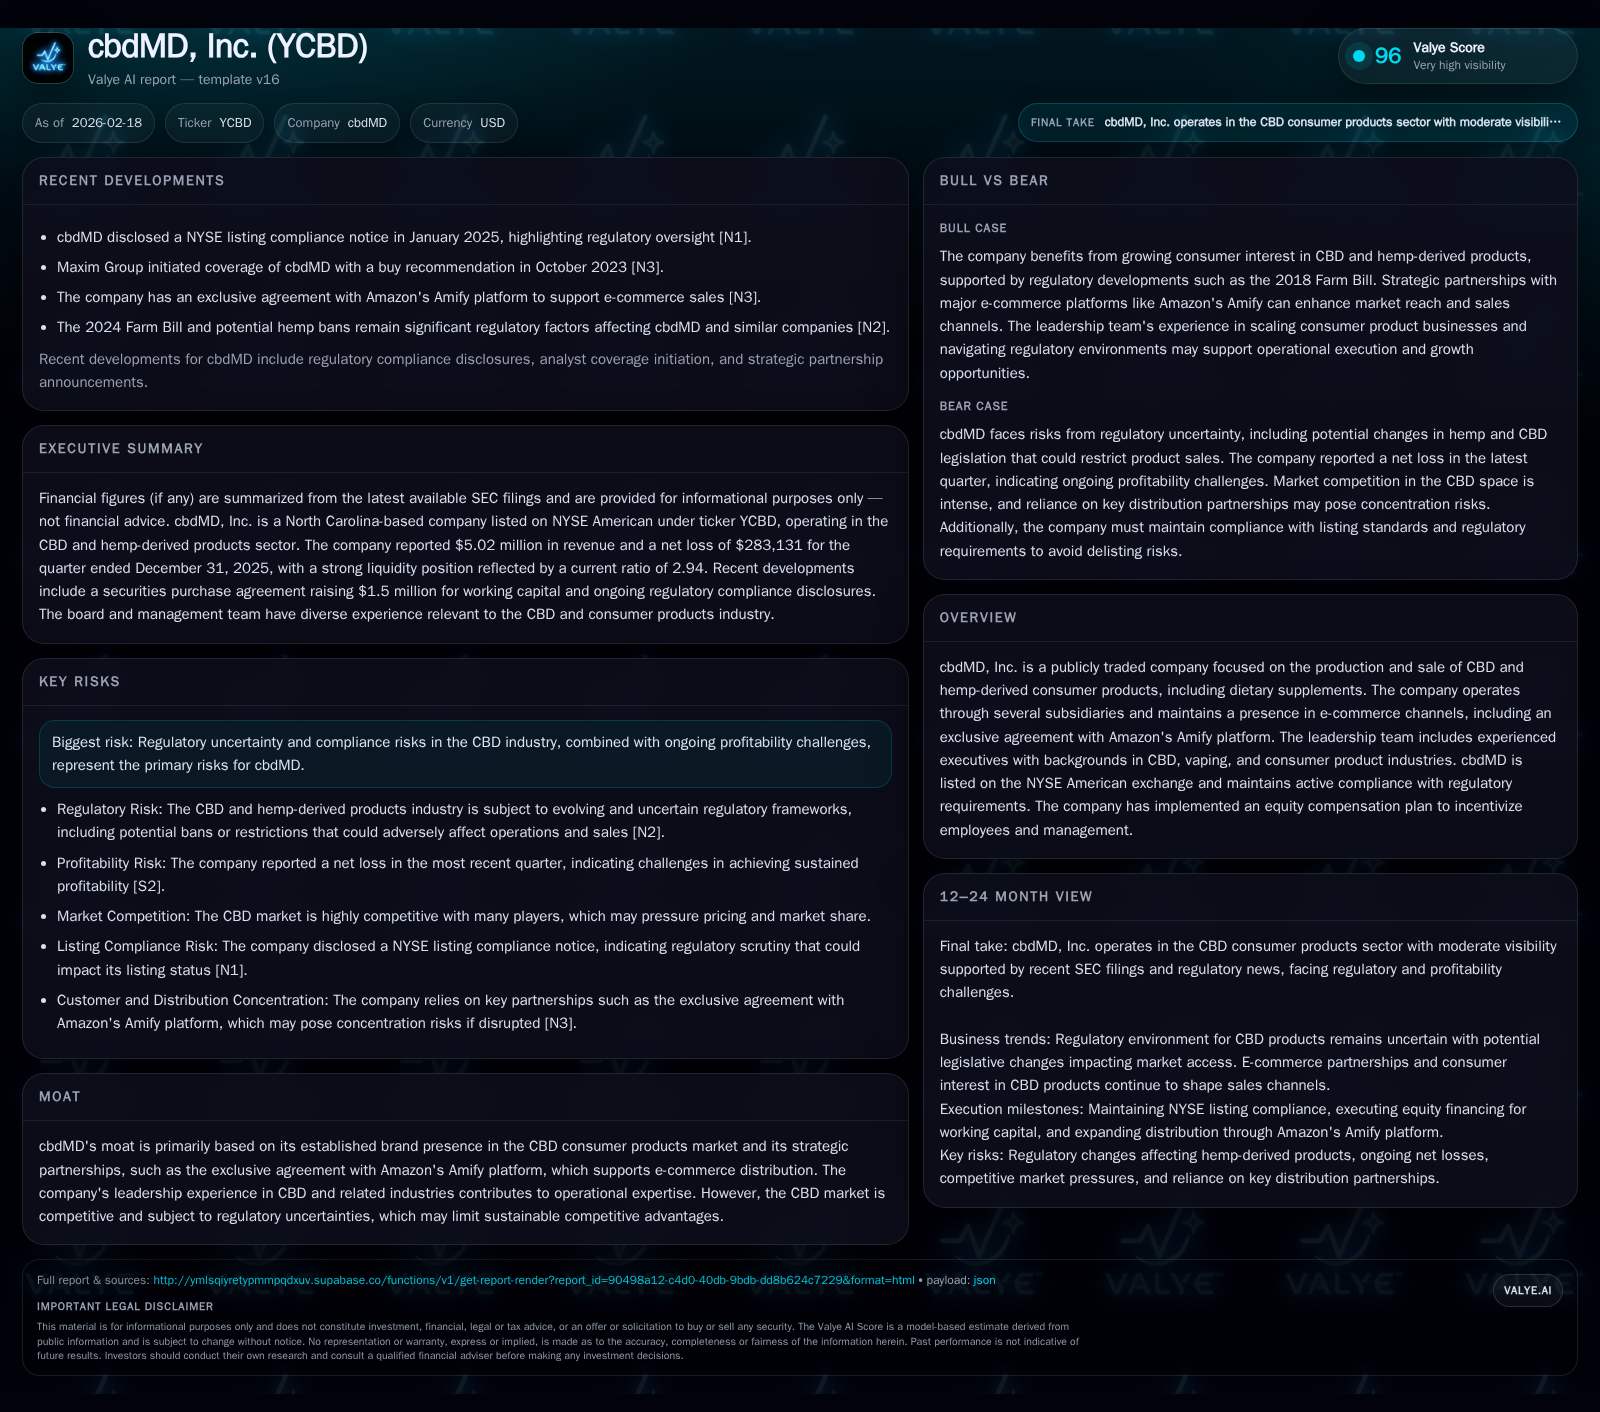
cbdMD maintains its foothold in the CBD consumer products sector through strategic e-commerce partnerships amid persistent losses and regulatory uncertainty.
cbdMD, Inc. has demonstrated revenue resilience despite a persistent downtrend since 2022, driven by its recognized brand and an exclusive Amazon Amify platform agreement. The company’s operating losses have contracted notably in 2025, reflecting disciplined cost management but continued negative net income and cash flows highlight ongoing profitability challenges. Regulatory complexities around CBD products continue to impose growth ceilings and risk factors, while strategic acquisitions like Gaia Botanicals signal measured expansion efforts. Capital structure moves including a Series B preferred issuance and launch of a sizable equity compensation plan underpin financial flexibility and management alignment as cbdMD navigates a competitive and evolving market.
Evolving Revenue Trends: Revenue and Operating Loss Analysis from 2022 to 2025
cbdMD has experienced a pronounced contraction in revenue over the last four fiscal years. From a peak of approximately $35.4 million in FY2022, revenues declined sharply to $24.2 million in FY2023 (-31.9% YoY) and further to about $19.5 million by FY2024 (-19.3% YoY). The trend softened approaching FY2025 with revenues declining only by -1.5% to roughly $19.2 million (all figures USD) [F1]. This deceleration in revenue erosion suggests some stabilization but underscores ongoing top-line pressure.
Despite this decline in scale, cbdMD’s operating income trajectory shows meaningful improvement: the operating loss narrowed from an outsized -$78.3 million in FY2022 to -$22.5 million drop-off by FY2023 (a reduction of about 71%), further reducing losses to -$3.3 million by FY2024 (an 85% improvement), and again contracting 34.8% to approximately -$2.16 million for FY2025 [F1]. This sizeable decrease in operating loss reflects focused cost discipline and perhaps more favorable gross margins or lower SG&A expenses relative to sales.
However, net income tells a more nuanced story with net losses fluctuating due to non-operating items; net loss increased markedly by over 12x from about -$0.15 million in FY2024 to nearly -$2 million in FY2025, likely influenced by restructuring or one-time charges amid operational improvements [F1]. Persistent negative free cash flow exacerbates concerns; operating cash flows remain negative at about -$1.45 million as of FY2025 end against minimal capital expenditure ($184K) indicating limited reinvestment—consistent with cautious capital deployment during earnings recovery attempts [F1].
Overall, cbdMD’s approximate return on equity remains negative near -28%, highlighting continued unprofitability despite improving operating metrics.
Historical performance (annual)
| FY | Rev ($mm) | Net ($mm) | CFO ($mm) | OpInc ($mm) | Rev YoY | Net YoY |
|---|---|---|---|---|---|---|
| 2025 | 19 | -2 | -1 | -2 | -1.5% | -1235.7% |
| 2024 | 19 | 0 | 0 | -3 | -19.3% | +99.0% |
| 2023 | 24 | -16 | -4 | -22 | -31.8% | -8.5% |
| 2022 | 35 | -15 | -15 | -78 |
Note: Omitted columns lack sufficient annual XBRL coverage in the provided tags (need ≥2 annual points): Capex, Div, Buybacks. Source: SEC companyfacts cache [F1].
Capital returns and efficiency (annual)
| FY | FCF ($mm) | ROE% |
|---|---|---|
| 2025 | -2 | -28.2 |
| 2024 | -1 | -7.8 |
| 2023 | -5 | -175.8 |
| 2022 | -16 | -46.6 |
Source: SEC companyfacts cache [F1].
Note: Net income YoY % impacted by comparison base volatility.
Strategic Drivers Behind Past Growth: Brand, Products, and Distribution Channels
cbdMD’s established brand position within the highly fragmented CBD consumer market forms a core pillar underpinning its sales resilience amid industry headwinds . Its product portfolio centers on dietary supplements derived from hemp-based CBD formulations targeting mainstream wellness consumers—a category increasingly crowded but still exhibiting growth potential.
A significant strategic asset lies in the exclusive e-commerce alliance with Amazon through the Amify platform—a channel highly relevant given the growing shift of consumer goods towards digital retail ecosystems post-pandemic . This relationship confers enhanced visibility on arguably the largest online marketplace globally, aiding customer acquisition while mitigating retailer fragmentation risks common to CBD product distribution.
Additionally, cbdMD operates via multiple subsidiaries allowing nimble brand segmentation and tailored product offerings across categories including pet-focused CBD items—which have become an emergent vertical within hemp-derived products due to rising pet wellness trends.
However, the competitive landscape remains intense as new entrants continuously erode pricing power while regulatory ambiguity limits marketing freedoms and innovation cadence.
Regulatory Environment and Market Constraints Impacting Future Expansion
The regulatory framework around hemp-derived CBD remains unsettled at both federal and state levels posing continuous compliance challenges that heighten operational risks for cbdMD [S4]. Though no recent litigation has been reported which signals a relatively clean compliance record currently [S4], regulatory scrutiny induces added administrative costs and restricts novel product introductions or claims—directly capping attainable market growth ceilings.
Investors monitoring cbdMD should pay particular attention to evolving FDA guidance post-2026 political transitions that could either tighten or relax regulatory oversight impacting labeling rules, permissible health claims, or interstate commerce provisions that govern hemp product distribution.
Investments and Acquisitions: Capital Deployment with an Eye on Operational Scale
A key maneuver reflecting cbdMD’s growth approach is the January 12, 2026 acquisition of Gaia Botanicals via an Asset Purchase Agreement for a combined issuance of up to approximately 950K shares inclusive of earnout provisions subject to future performance targets [S3][S24]. Gaia Botanicals adds not only inventory but extends cbdMD’s digital footprint through https://bluebirdbotanicals.com/, expanding into educational content alongside ecommerce sales aligned with premium CBD consumables.
Capital expenditures have remained subdued relative to historic levels—a modest decline of approx 3%, from $190K in FY2024 down to $184K in FY2025—suggesting measured reinvestment aligned with cash conservation objectives rather than aggressive scaling spend [F1]. This restrained capex aligns with operational realities seen across mid-tier CBD firms where infrastructure investments prioritize efficiency gains rather than expansionary capacity given margin compression conditions.
Capital Structure, Equity Compensation, and Financial Health Snapshot
To address liquidity needs amidst persistent operating losses, cbdMD secured gross proceeds of $1.7 million through Series B Convertible Preferred Stock issued on September 29, 2025; net proceeds were $1.5 million earmarked exclusively for working capital purposes signifying critical short-term funding support [S9][S10].
Importantly, this preferred stock carries a dividend rate of 10% annually payable in common shares or cash contingent upon covenant satisfaction—indicating financial engineering balancing shareholder dilution risks with solvency preservation.
Equity compensation has been revamped substantially: following expiration of earlier plans (2015 Plan), cbdMD unveiled the expansive 2025 Equity Incentive Plan reserving approximately 891,316 common shares plus an "evergreen" provision for annual increases up to max thresholds ([S5]-[S8],[S12]). This move aims at attracting and retaining talent through equity alignment amidst an industry facing volatile headwinds.
Financial health as measured by liquidity remains cautiously robust; current assets totaled ~$8.17M versus current liabilities near $2.77M for a healthy current ratio just shy of three (2.94), providing moderate cushion for near-term obligations without excessive leverage strain [F1]. Total equity surged from under $2M at end-FY24 to over $7M at end-FY25 partly reflecting capital injections coupled with improved retained deficit management.
Forecast Tracker: Key Milestones and What to Watch Next for cbdMD
Absent explicit forward-looking guidance in recent disclosures or news releases (last quarterly report filed Feb ‘26), stakeholders should focus on several critical indicators moving forward:
- Margins trajectory especially shifts from operating loss narrowing toward breakeven or profitability,
- Impact assessment of regulatory developments post-2026 elections affecting product approvals or interstate commerce,
- Integration progress and contribution from Gaia Botanicals acquisition including cross-selling synergies,
- Digital sales enhancements particularly leveraging Amazon Amify exclusivity,
- Management execution on equity plan dilution management versus retention benefits,
- Quarterly filings confirming cash flow trends amid capex & working capital fluctuations.
Given these milestones align closely with ongoing industry structural dynamics—particularly evolving compliance regimes—it is prudent to regard medium-term prospects as cautiously optimistic conditional on internal expense discipline coupled with external regulatory clarity breakthroughs.
This analysis synthesizes all publicly available filings up to February 18th, 2026, focusing strictly on observed data without speculative forecasts or investment recommendations.
Disclaimer: This is research-only, informational analysis and not investment advice. It may include AI-generated interpretation and general industry context. Always verify important details using primary sources.
Comments