
Zeo Energy Strengthens Vertical Integration While Managing Industry Headwinds
Zeo Energy’s latest quarterly report highlights operational resilience amid ongoing market challenges, reflecting strategic vertical integration and multi-channel sales expansion.
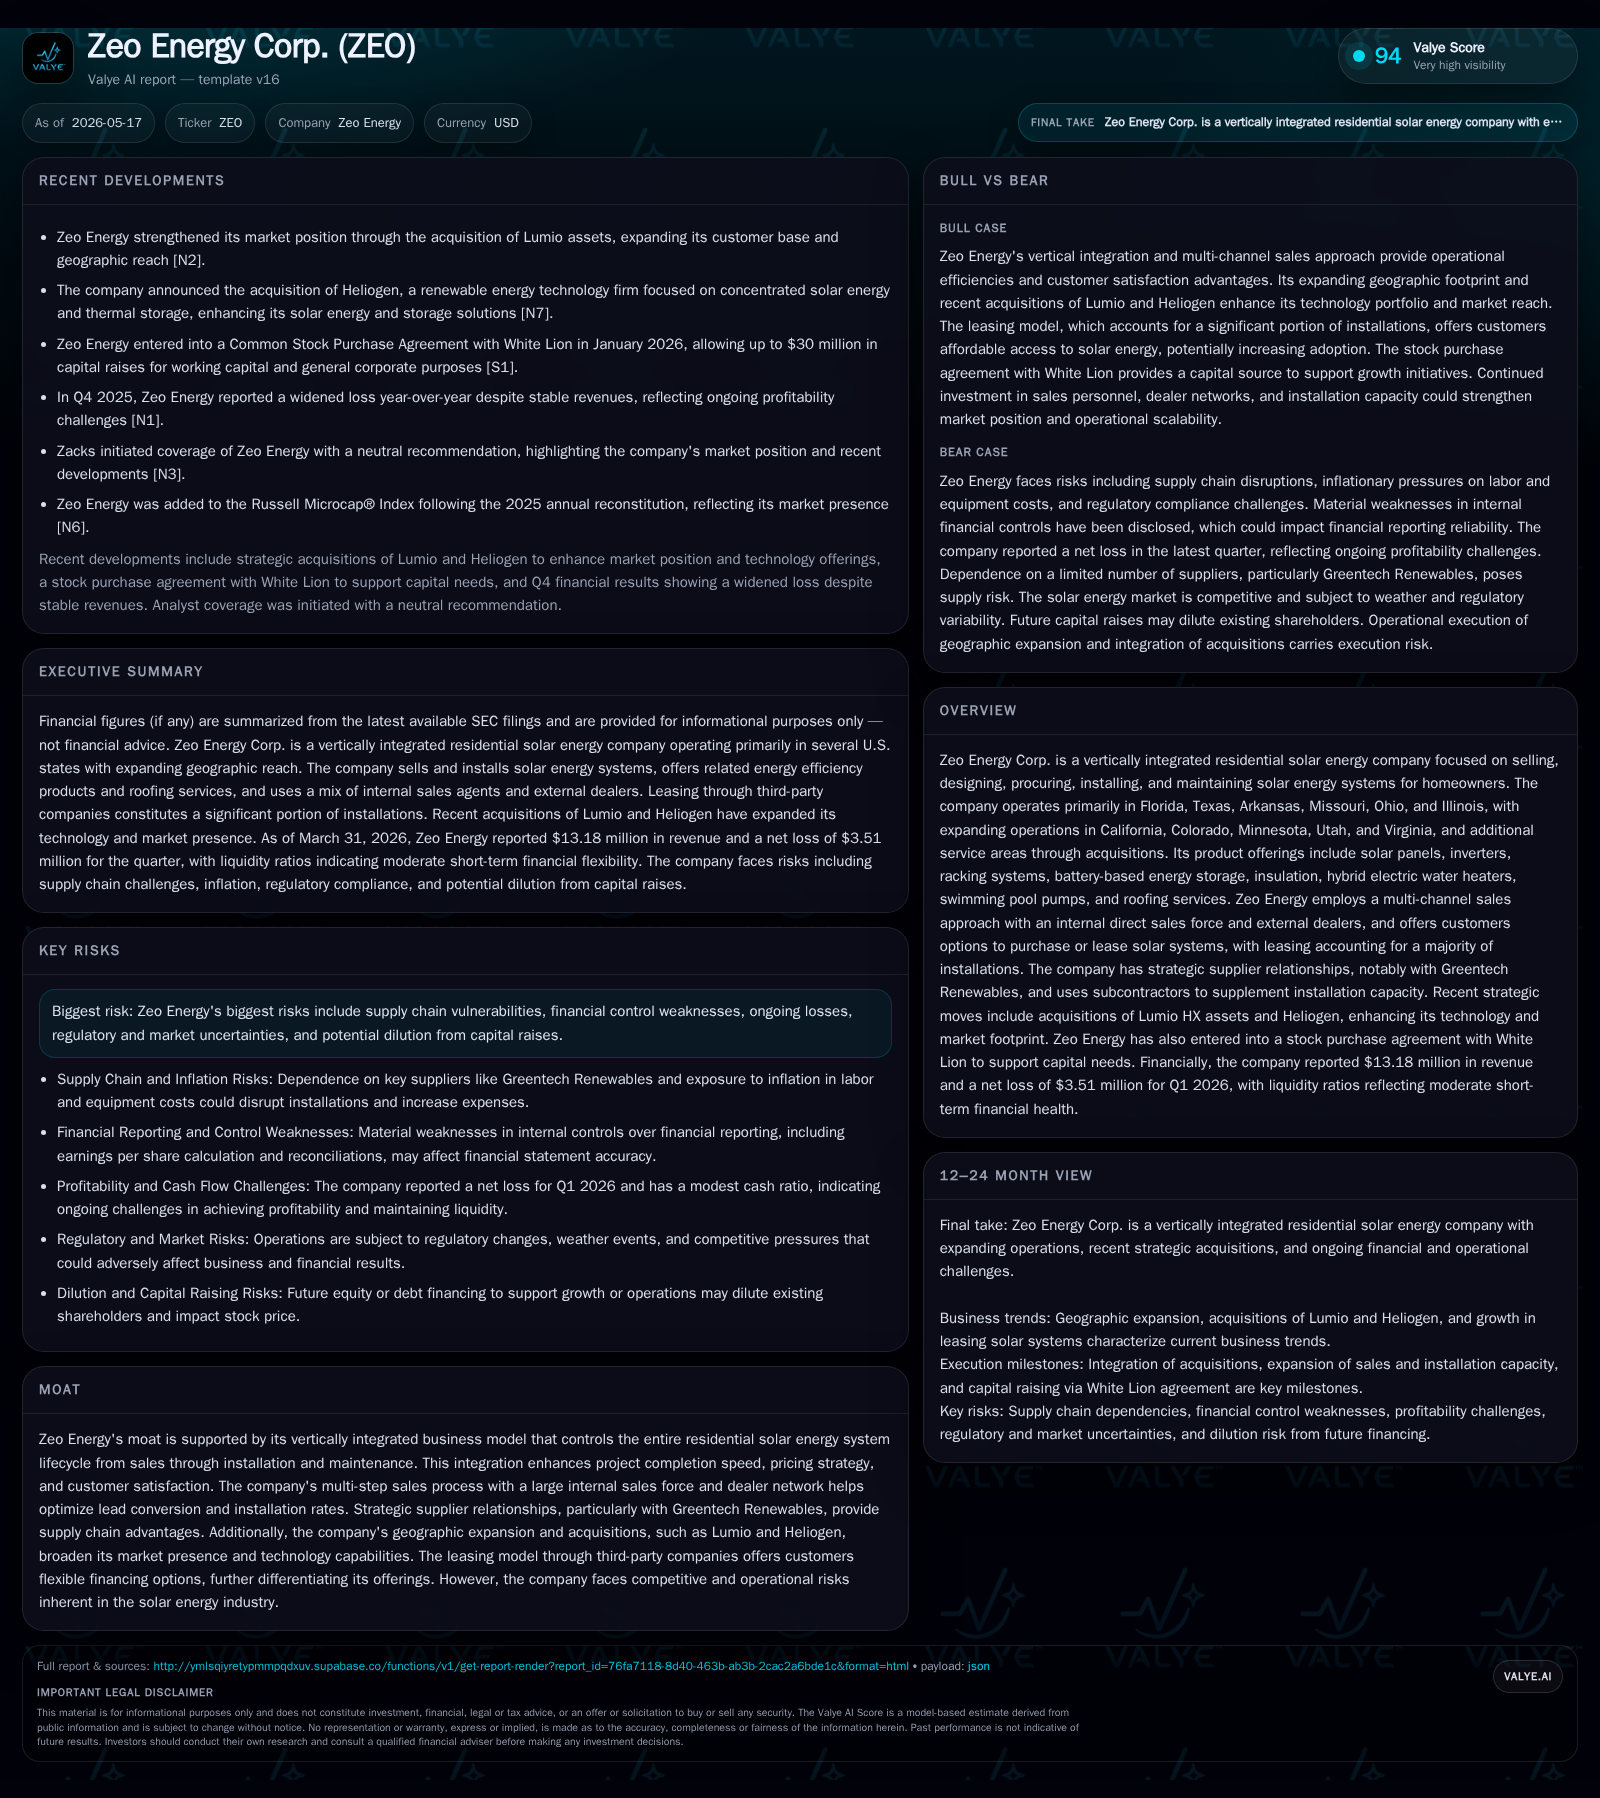
In the quarter ended March 31, 2026, Zeo Energy maintained stable revenue generation while continuing to absorb operating losses typical of growth-phase residential solar firms. The company’s vertically integrated model supports expedited project delivery and pricing control across multiple product and service offerings. Its expanding geographic footprint and dealer network underpin growth prospects, though supply chain vulnerabilities and regulatory uncertainties remain key risks. Liquidity metrics suggest adequate operational runway as Zeo navigates industry dynamics.
Latest Operating Update Anchored on Q1 2026
An April 24 event filing [S3] elaborates on the company's multi-channel sales initiatives—highlighting efforts to refine internal sales processes and expand the external dealer network—measures expected to improve lead conversion and backlog throughput. The balance sheet as of March 31 displays current assets exceeding current liabilities by a factor of approximately 1.65 [F1], indicating sufficient short-term liquidity to sustain ongoing operations while investments in geographic expansion continue.
Vertical Integration Defines Zeo’s Residential Solar Model
Zeo Energy operates a vertically integrated business model covering the entire residential solar project lifecycle: from initial customer engagement through sales design, procurement of hardware (solar panels, inverters, racking), installation services including roofing integration, maintenance contracts, to energy efficiency upgrades like hybrid electric water heaters and battery backup systems [S1]. This full-spectrum control aids in accelerating project completion timelines and optimizing cost structures by reducing reliance on third parties.
A majority share of system installations result from leasing agreements facilitated by third-party financiers—this leasing penetration is crucial for volume growth as it lowers upfront barriers for homeowners while generating recurring revenue streams [S1]. The company leverages strategic supplier partnerships (notably Greentech Renewables) helping mitigate supply chain disruptions prevalent industry-wide.
Operating initially in core markets such as Florida and Texas since early 2022, Zeo expanded into Arkansas (2023), Missouri (2023), Ohio and Illinois (2024), and further extended its footprint into California, Colorado, Minnesota, Utah, and Virginia during 2025 [S1][S3]. It has also augmented capacity through acquisitions like Lumio HX which brought partially completed projects primarily in California and several East Coast states into its portfolio.
Competitive Positioning Within Regional Solar Markets
Zeo competes directly with traditional electric utilities that dominate local retail electricity markets as well as other residential solar providers ranging from purely installation-focused firms to national renewable energy conglomerates [S1]. Its edge stems from fixed-price leasing options that counteract fluctuating utility tariffs by offering predictable cost savings to customers over contract duration.
The dual-pronged sales approach—with an expansive internal direct sales force complemented by external dealers—enhances market penetration compared to competitors relying solely on one distribution channel. However, regional market maturity varies significantly; regulatory frameworks differ state-to-state impacting incentive availability and program longevity thus influencing consumer uptake rates.
The company’s vertical integration offers pricing flexibility unavailable to firms dependent on subcontracted installation or equipment procurement—a strategic moat allowing Zeo to better absorb component price volatility while maintaining consistent margins within competitive benchmarks.
Drivers Supporting Growth Trajectory
Key drivers fueling Zeo’s expansion include geographic diversification into higher-growth states with robust solar policies along with cross-selling ancillary services like insulation improvements and roofing replacements that increase average revenue per customer.
Installation capacity benefits from robust dealer network growth coupled with direct cash purchase options complementing leasing transactions; this mix broadens addressable customer segments accommodating varying credit profiles [S2]. Leasing contracts dominate new orders providing recurring cash flow stability while elevating total installed system volumes—a critical KPI for investor scrutiny.
Key Risks and Constraints for Near-Term Outlook
The company faces inherent risks centered around supply chain fragility given reliance on select suppliers which could delay installations if shortages arise unexpectedly. Financial control gaps identified in filings signal management attention is warranted to tighten governance processes amidst rapid scaling efforts [S2].
Solar industry incentives—federal tax credits, state rebates—are subject to legislative risk; any diminution can materially impact affordability thresholds influencing consumer decisions negatively [S1]. Additionally macroeconomic headwinds such as housing market softness or labor market instability could suppress homeowner willingness to enter long-term contracts despite projected energy savings.
Competition from incumbent utilities remains formidable due to entrenched relationships and scale advantages. Pricing promotions by utilities could undercut Zeo’s appeal unless the company maintains compelling value propositions leveraging fixed leases.
Upcoming Catalysts and Milestones to Monitor
Investors should watch for quarterly updates detailing improvements in leasing contract deployments alongside dealer network expansion metrics that drive installation throughput. Management commentary on supply chain resilience initiatives will be pivotal especially if industry-wide constraints persist.
Revenue progression trends assessing success in new markets—California notably—and margin improvements reflecting operational leverage via vertical integration will provide insight into scalability. Any official guidance revisions or disclosures regarding backlog size conversion rates would be informative signals of execution efficacy.
Additionally monitoring legislative developments affecting renewable energy incentives at federal or state levels remains essential given their outsized influence on demand curves.
Financial Snapshot: Liquidity and Operating Performance
Latest financial snapshot
| Metric | Value | Period |
|---|---|---|
| Cash & equivalents | $1731160 | |
| 2026-03-31 | ||
| Total debt | $79112 | |
| 2025-12-31 | ||
| Net debt | $-1652048 | |
| 2025-12-31 | ||
| Current assets | $20mm | |
| 2026-03-31 | ||
| Current liabilities | $12mm | |
| 2026-03-31 | ||
| Current ratio | 1.65x | |
| 2026-03-31 |
Source: SEC companyfacts cache [F1].
| Metric | Value (USD) |
|---|---|
| Cash & Equivalents | 1,731,160 |
| Total Debt | 79,112 |
| Current Assets | 20,032,527 |
| Current Liabilities | 12,113,330 |
| Current Ratio | 1.65 |
| Revenue (annualized) | ~69.3 million |
As of the latest quarter ending March 31, 2026 [F1], Zeo Energy holds approximately $1.7 million in cash with negligible total debt (~$79K), signifying low leverage risk amid ongoing operating deficits totaling over $14 million net losses annually.
This analysis is grounded exclusively in current reported SEC disclosures and companyfacts data without speculation or investment recommendations. It aims to provide an objective assessment of Zeo Energy Corp.’s operating environment within the residential solar sector as of Q1 2026.
Disclaimer: This is research-only, informational analysis and not investment advice. It may include AI-generated interpretation and general industry context. Always verify important details using primary sources.

Comments