
ACCO BRANDS Corp's Q1 2026 Earnings Reflect Margin Pressure Despite Revenue Growth
Q1 results show sales growth driven by pricing yet operational challenges sustain an operating loss.
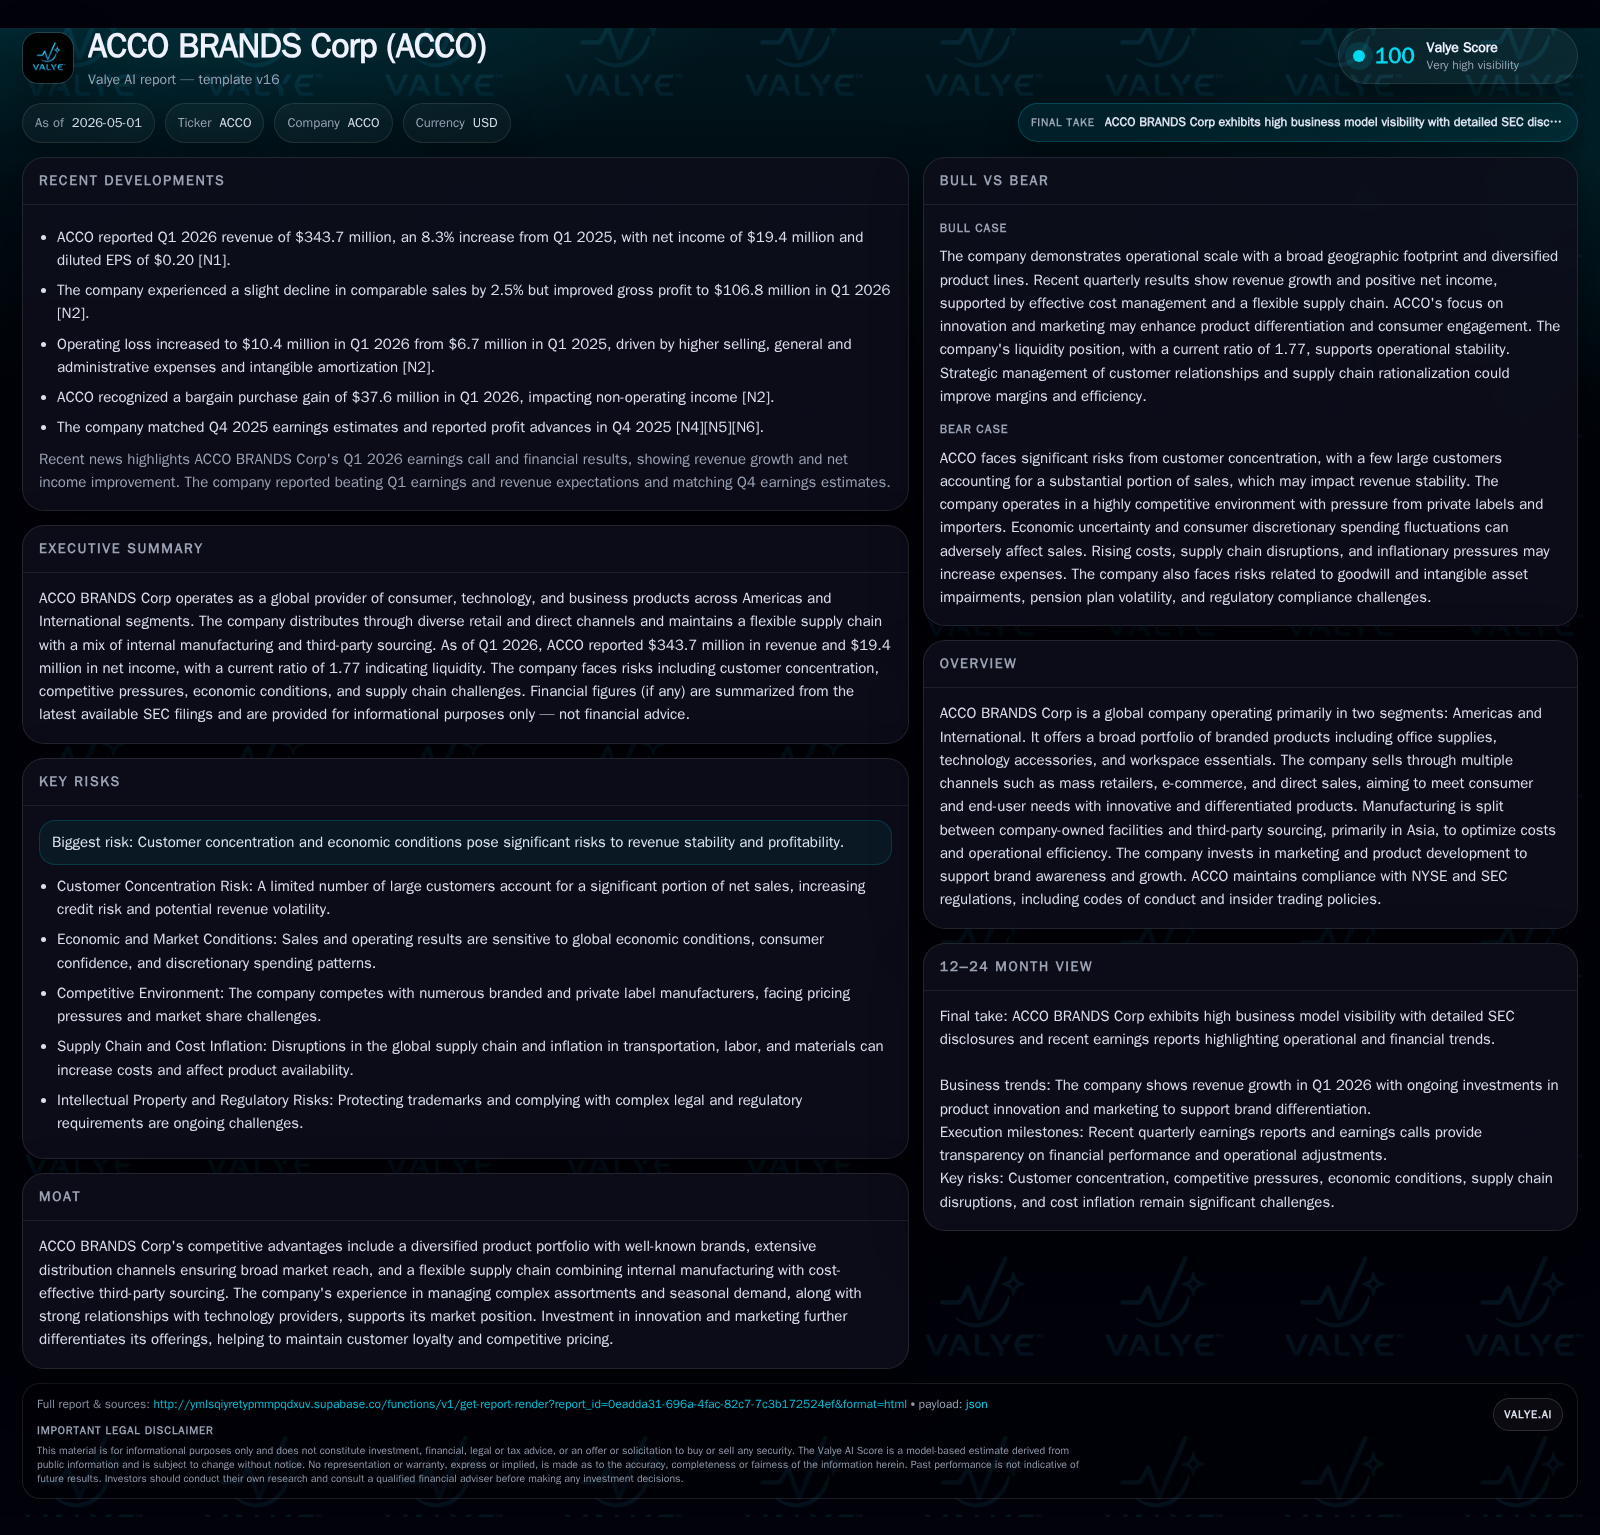
In Q1 2026, ACCO BRANDS Corp posted net sales of $343.7 million, up 8.3% year-over-year, primarily driven by pricing initiatives amid a slight decline in comparable sales. However, the company recorded an operating loss of $10.4 million, worsened by increased intangible amortization and higher selling expenses. With a diversified global product portfolio and extensive distribution channels, ACCO faces persistent risks from customer concentration, intense competition, and economic variability while continuing to invest in innovation and supply chain efficiency to support growth.
Recent Operating Update
In the first quarter ended March 31, 2026, ACCO BRANDS Corp reported net sales of $343.7 million, an increase of 8.3% compared to the same period last year primarily due to price increases implemented across the portfolio despite a comparable sales decline of 2.5% [S2]. Gross profit rose to $106.8 million but gross margin contracted slightly to 31.1%, reflecting cost pressures. Operating expenses outpaced gross profit growth: selling, general and administrative (SG&A) expenses increased by $6.4 million (6.9%) and intangible amortization rose sharply by approximately $4.5 million (33%) compared to Q1 2025 [S2]. Consequently, operating loss expanded to $10.4 million versus a loss of $6.7 million in the prior year period.
Added non-operating expenses included a net interest expense of $9.3 million and non-operating pension-related costs rising significantly to $3 million [S2]. Offsetting some negative income statement effects was a non-recurring bargain purchase gain recognized this quarter of $37.6 million related to acquisitions integration [S2]. The net result was a positive net income of $19.4 million or diluted earnings per share of $0.20 compared with a loss in the year-ago quarter.
The company communicated that ongoing inflationary pressures in raw materials and logistics combined with increased marketing investments have weighed on short-term profitability even as pricing actions are contributing positively to revenue volume [N2]. The management discussion reaffirmed focus on cost rationalization programs alongside continued investment in innovation and digital channels.
Business Model
ACCO BRANDS derives its revenues primarily through the design, manufacture or sourcing, marketing, and sale of branded consumer and business products across two operating segments: Americas (U.S., Canada, Latin America) and International (primarily EMEA, Australia/New Zealand, Asia) [S1][S6][S13]. The company’s extensive product range spans office supplies such as binders and planners (under brands like AT-A-GLANCE®), technology accessories including gaming controllers (PowerA®), workspace machines/tools (GBC® laminators), presentation boards (Quartet®), ergonomic furniture (Buro® in International segment), and writing/art supplies (Derwent®, Esselte®) [S1][S13].
Revenue flows from wholesale relationships with large mass retailers and office product superstores as well as specialty distributors and direct e-commerce sales [S1]. Demand is driven by end-user needs across schools, offices, homes, and gaming enthusiasts.
Manufacturing is balanced between company-owned plants producing approximately 40% of goods in countries where it operates including U.S., Europe, and Australia/New Zealand, while roughly 60% of products are sourced via third-party suppliers primarily in Asia to manage costs effectively [S1]. This flexible supply chain model reduces capital expenditures while allowing seasonal demand responsiveness.
Investment emphasis lies heavily on product development teams partnering with technology vendors to foster differentiated offerings that align with evolving consumer trends such as ergonomic work solutions or gaming peripherals [S1]. Marketing expenditure supports brand awareness through digital campaigns and in-store promotions aiming for strong customer loyalty against commoditized competitor products.
Industry Structure and Competitive Position
ACCO operates within highly competitive markets characterized by multiple branded players alongside significant private label participation from retail customers who increasingly import their own products directly from low-cost international sources [S1][S6]. This dynamic constrains pricing power though ACCO's extensive brand portfolio provides some customer differentiation advantage.
The company's scale allows leverage over shelf space negotiations but also exposes it to bargaining power from large retail customers concentrating purchases [S6][S9]. Maintaining relevance through innovation is critical given shifting workplace practices such as hybrid work fueling demand for home office products alongside traditional commercial demand.
Technological collaboration in gaming accessories presents a niche competitive edge leveraged via licensed relationships with major console manufacturers providing market entry barriers [S1]. Similarly, ACCO’s ability to promptly adjust product assortments seasonally supports supply-demand alignment that fewer smaller competitors can manage effectively.
Growth Drivers
Several structural factors support ACCO’s growth trajectory:
- Innovation pipeline focused on ergonomics expansion (Buro acquisition) and premium audio through EPOS acquisition extending International segment offerings beyond traditional office products [S16].
- Adaptation to hybrid work trends increases demand for home-based office supplies requiring new form factors or connectivity features.
- E-commerce expansion enhances direct engagement with end-users enabling faster trend response plus margin improvement efforts over traditional wholesale models.
- Global footprint rationalization targets facility closures or repurposing within owned manufacturing operations improving asset utilization metrics [S1].
- Pricing strategy that has mitigated raw material inflation impacts but requires careful management due to competitive pressure noted in comparable sales declines seen this quarter [S2].
Risks / Watchpoints / Growth Constraints
Key risks identified from filings include:
- Customer concentration: Top ten customers contribute major portions of revenue creating vulnerability if purchasing patterns change or terms tighten adversely affecting gross margins [S6][S9].
- Economic sensitivity: Demand levels fluctuate especially during recessions or periods of high inflation when discretionary spending tightens impacting both volume and price tolerance [S6].
- Supply chain disruptions: Reliance on Asian suppliers for majority sourcing exposes the firm to logistical delays or cost volatility given geopolitical tensions or pandemic outbreaks [S15][S17].
- Competitive intensity: Increasing private label encroachment puts pressure on shelf presence and pricing that could erode market share without continued product differentiation [S1][N5].
- Leverage profile: Net debt remains substantial near $778 million as measured versus cash balances though current liabilities remain manageable; compliance with covenants post recent amendments will require caution especially if leverage rises or cash flow weakens unexpectedly [F1][S12][S20][S28].
- Intellectual property litigation risk, particularly around technology accessories segments presents potential contingent liabilities that could impact earnings unpredictably [S9][S17].
What To Watch Next
Important forthcoming indicators include:
- Quarterly comparable sales trends clarifying whether exiting inventory destocking at large customers stabilizes or continues influencing reported volumes negatively.
- Updates on margins particularly gross margin recovery as supply chain inflationary pressures ease or intensify.
- Execution on synergy realization from recent acquisitions like EPOS providing expanded category diversification.
- Management guidance revisions offering signals about demand visibility amid macroeconomic uncertainties.
- Potential restructuring announcements within manufacturing footprint rationalization program aimed at improving operating efficiencies per stated strategic priorities.
Financial Profile Summary
As of March 31, 2026, ACCO reported current assets around $797.5 million against current liabilities totaling approximately $450.3 million yielding a current ratio near 1.77 indicating reasonable short-term liquidity coverage [F1][S2]. Long-term debt remains elevated near $819.7 million gross translating into a net debt position roughly estimated at $778.5 million given lower cash balances albeit based on best available data points spanning years; care should be used interpreting historic cash figures without updated disclosure [F1]. Interest rates on debt are partially fixed; recent credit agreement amendments have relaxed leverage covenants temporarily allowing some balance sheet flexibility through H2 2026 [S12][S20][S28]. The company’s ability to manage leverage while funding ongoing innovation initiatives will remain critical.
Latest Financial Snapshot Table
Latest financial snapshot
| Metric | Value | Period |
|---|---|---|
| Current assets | $798mm | |
| 2026-03-31 | ||
| Current liabilities | $450mm | |
| 2026-03-31 | ||
| Current ratio | 1.77x | |
| 2026-03-31 |
Source: SEC companyfacts cache [F1].
This analysis synthesizes information exclusively from latest SEC filings through May 2026 along with supporting news materials without extrapolation beyond disclosed data points or issuing investment advice.
Disclaimer: This is research-only, informational analysis and not investment advice. It may include AI-generated interpretation and general industry context. Always verify important details using primary sources.
Comments