
Ascent Industries’ Chemicals-as-a-Service Faces Early Profitability Pressures Amid Strategic Expansion
First-quarter 2026 results reveal operational challenges even as Ascent bolsters its specialty chemicals platform through acquisitions and R&D.
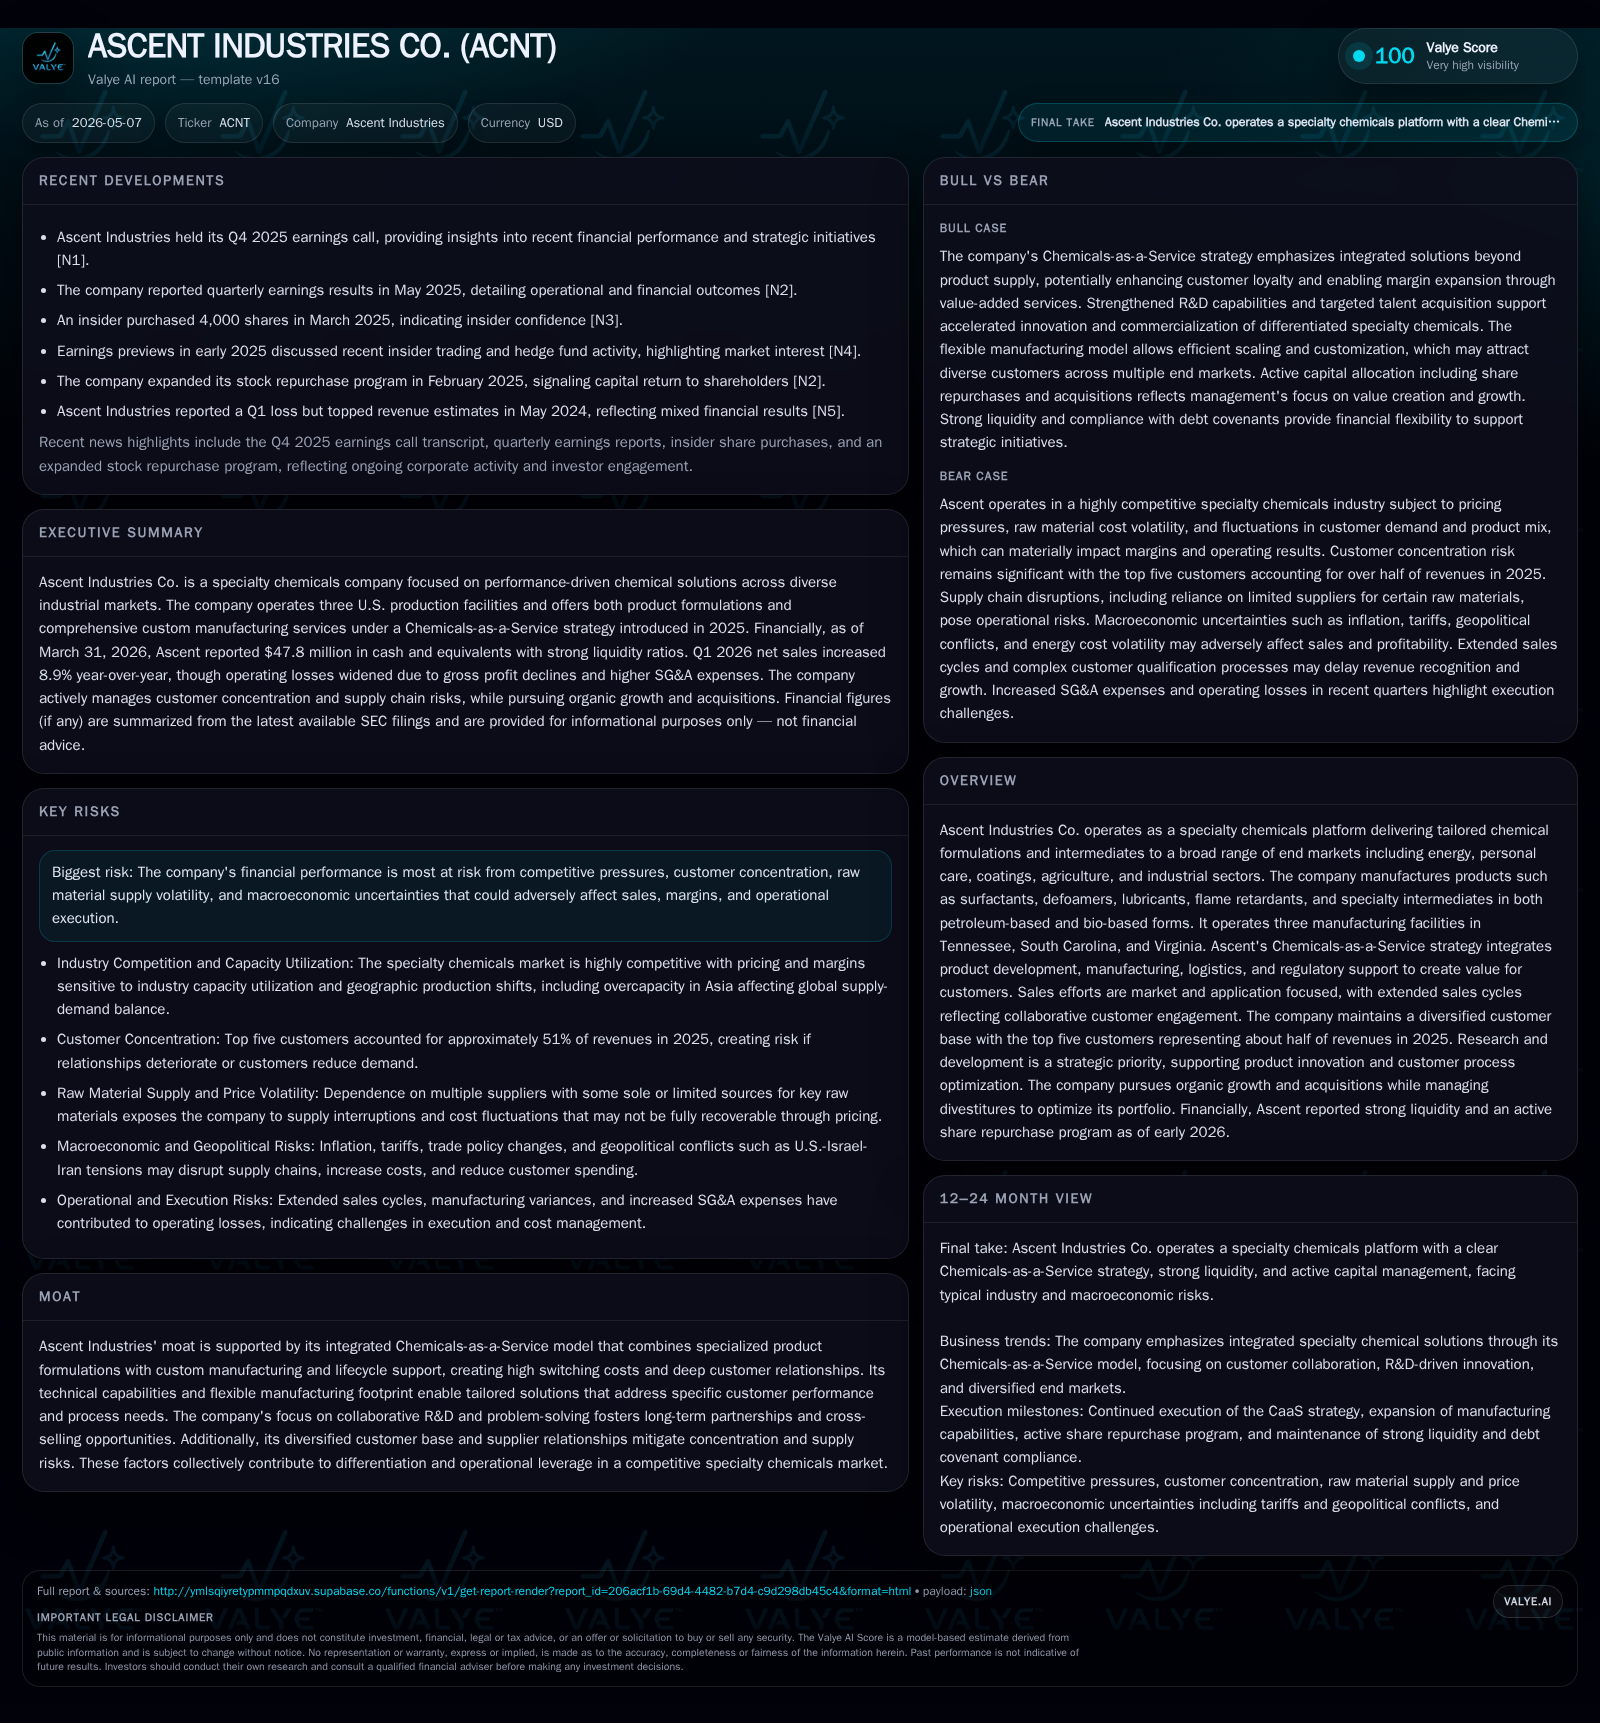
Ascent Industries Co. reported an 8.9% sales increase in Q1 2026 driven by strategic R&D investments, a new Chemicals-as-a-Service model, and a recent acquisition expanding its product capabilities. However, the company recorded a net loss and negative adjusted EBITDA for the quarter, reflecting ongoing costs tied to its growth initiatives and macroeconomic headwinds. Ascent’s integrated service approach aims to deepen customer relationships and differentiate in a competitive specialty chemicals market but depends critically on sustained demand, pricing power, and raw material stability.
Recent Operating Update: Q1 2026 Results Highlight Mixed Momentum
In its latest 10-Q filing dated May 6, 2026 [S2], Ascent Industries Co. posted consolidated net sales of $19.4 million for the first quarter — an increase of 8.9% year-over-year — driven primarily by the company’s continued emphasis on tailored specialty chemical solutions alongside a recent strategic acquisition announced in an 8-K filing on May 6 [S3]. Despite top-line growth bolstered by the purchase of Midwest Graphics Sales Inc.’s assets for $14 million early May [S3], the company reported a net loss from continuing operations of approximately $2.0 million in Q1 2026 compared to a net loss of $2.2 million during Q1 2025.
Adjusted EBITDA— a key performance measure underlining operational profitability before non-cash charges—was negative $963 thousand in Q1 2026 after positive adjusted EBITDA of $1.97 million in Q1 of the prior year [S21]. This swing largely reflects increased investment spending related to new product development under Ascent’s Chemicals-as-a-Service (CaaS) strategy plus elevated operating expenses tied to R&D expansion and scaling efforts across manufacturing sites.
According to management commentary [S2], macroeconomic factors including recently implemented tariffs and inflationary pressures continue to influence cost structures moderately but have not yet materially eroded sales or profitability this quarter. The company maintains cautious optimism about offsetting raw material cost increases via pricing actions and internal cost containment.
Business Model: Integrated Specialty Chemicals Solutions with Service Differentiation
Ascent Industries operates exclusively within the specialty chemicals space as its sole reportable segment [S1][S2]. The company generates revenues by developing and producing performance-driven chemical formulations spanning applications such as oil & gas process aids, household cleaning agents, personal care ingredients, coatings additives, agriculture formulations, water treatment chemicals, automotive components, pulp & paper processing aids, and more.
The core commercial offering blends proprietary surfactants, defoamers, lubricating agents, flame retardants, and specialty intermediates provided in both petroleum-based versions as well as bio-based alternatives [S1]. A critical competitive differentiator is Ascent’s Chemicals-as-a-Service model launched in 2025 [S1], integrating:
- Collaborative discovery & development accelerating solution time-to-market,
- Custom manufacturing flexibility including multi-step reaction chemistries,
- Regulatory support navigating complex compliance requirements,
- End-to-end logistics supporting reliable delivery,
- Lifecycle product optimization encouraging long-term partnerships.
This model shifts typical industry transactional dynamics toward embedded problem-solving relationships characterized by longer sales cycles often measured over multiple quarters [S7]. By meeting nuanced customer performance specifications at scale without forcing heavy upfront capital investment on their part, Ascent fosters higher switching costs.
The business operates three domestic production facilities located in Tennessee (Cleveland), South Carolina (Fountain Inn), and Virginia (Danville) [S1]. These plants host flexible multipurpose equipment supporting blending complexity that complements dedicated customer assets maintained where needed.
Industry Structure and Competitive Positioning
The specialty chemicals sector is characterized by fragmentation with numerous regional players competing primarily on formulation innovation and service reliability. Pricing power tends to be variable due to macroeconomic capacity imbalances — notably significant overcapacity originating in Asia — which can drive price erosion when exports pressure US markets [S28].
Technological maturity coupled with growing sustainability demands pushes incumbents like Ascent to continuously invest in R&D aimed at bio-based chemistries or greener additives addressing evolving regulations and consumer preferences [S28]. Capturing regulatory expertise internally is essential given lengthy qualification cycles customers navigate before switching suppliers.
Customer concentration remains an important consideration: Ascent’s five largest customers accounted for roughly half (51%) of revenues in 2025 [S7], underscoring the risk associated with dependency amid extended contract negotiations typical in the industry.
Supplier diversity alleviates some procurement risk since over 95% of raw materials originate domestically with top five suppliers accounting for only about a third of purchases by value [S7]. The company actively monitors tariff impacts stemming from US trade policy changes post-IEEPA Supreme Court ruling early 2026 [S19], seeking to shield operational margins through dual sourcing where feasible.
Growth Drivers
Expansion via Chemical-as-a-Service Platform
Ascent positions itself as a differentiated player by bundling specialized chemical formulations with comprehensive services along the entire value chain—from initial R&D engagement through commercial manufacturing scale-up to regulatory navigation. This tight integration supports deepened client collaboration fostering stickiness and cross-selling opportunity as customers view Ascent increasingly as a partner rather than merely a supplier [S1][S16].
Strengthened R&D Capabilities
Management has invested significantly in technical talent throughout the past year enhancing formulation innovation velocity and application breadth [S16]. By aligning research teams closely with sales functions engaging direct customer feedback loops around specific processing needs or target outcomes the company accelerates commercialization timelines.
Targeted M&A Complementing Organic Initiatives
The May 4 acquisition adds proprietary assets expanding coatings-related chemistry platforms consistent with Ascent’s strategic roadmap intended both to diversify product offerings beyond traditional lines like surfactants while expanding geographic reach within niche sectors [S3]. Historically streamlined divestitures of non-core tubular businesses (Bristol Metals & American Stainless Tubing) during 2025 freed financial resources for such focused reinvestment efforts [S1][S18].
Stable Liquidity Supports Execution Flexibility
With over $47 million cash on hand at quarter-end plus fully undrawn revolving line capacity exceeding $14 million [S2], liquidity reserves mitigate near-term execution risks associated with investment cycles or external shocks influencing supply chains or working capital needs.
Risks / Watchpoints / Growth Constraints
- Margin Compression Risk: Negative adjusted EBITDA indicates current pressure from scaling costs or potential pricing resistance amid competition or input inflation requiring close monitoring for margin inflection.
- Customer Concentration: Reliance on relatively few large customers means contract renewals or volume adjustments can have outsized effects on revenue stability.
- Raw Material Volatility: While majority domestic sourcing reduces supply shock exposure somewhat, fluctuations in petrochemical feedstock prices or sudden tariff actions could strain cost pass-through ability.
- Lengthy Sales Cycles: Extended qualification periods typical within specialty chemicals may delay revenue recognition from new product wins introduced through R&D efforts.
- Competitive Intensity: Emergence of alternative chemistries with improved environmental profiles or lower-cost regional producers remains a persistent challenge.
- Regulatory Uncertainty: Evolving global chemical regulations require continuous adaptation which could impact existing formulations or necessitate costly reformulations impacting speed-to-market.
What to Watch Next
Investors should monitor the following milestones closely:
- Integration progress from May’s asset purchase including realized synergies or capacity utilization gains;
- Margins trends through subsequent quarters indicating operating leverage realization;
- Pipeline conversion rates evidencing traction from new product introductions under CaaS;
- Raw material pricing movements relative to managed cost offsets;
- Any updates related to tariffs especially reflecting potential refund procedures post-February Supreme Court decision;
- Sales concentration evolution particularly relative to customer base diversification efforts;
- R&D output metrics such as number/pace of qualification completions contributing incremental revenue streams;
- Capital expenditure adherence against sub-$5.1 million guidance maintaining balance between growth investments and prudent cash deployment.
Financial Profile Summary
Latest financial snapshot
| Metric | Value | Period |
|---|---|---|
| Cash & equivalents | $48mm | |
| 2026-03-31 | ||
| Current assets | $74mm | |
| 2026-03-31 | ||
| Current liabilities | $9mm | |
| 2026-03-31 | ||
| Current ratio | 8.69x | |
| 2026-03-31 |
Source: SEC companyfacts cache [F1].
Reflecting latest quarterly snapshot data [F1][S2]: FY End '24 |
The liquidity position supports operational needs without reliance on external debt financing while lease obligations stand at $13.1 million primarily related to manufacturing real estate/equipment rentals due per terms disclosed in notes [S2]. Share repurchases were active in Q1 with nearly 296 thousand shares bought back at an average price just under $13 representing capital return alongside growth funding strategies [S20].
Disclaimer
This analysis presents information based solely on publicly available SEC filings referenced herein without any investment advice or recommendations. Readers should consider their own circumstances before making decisions relating to Ascent Industries Co., taking into account forward-looking uncertainty inherent in any corporate forecast or strategy discussion.
Disclaimer: This is research-only, informational analysis and not investment advice. It may include AI-generated interpretation and general industry context. Always verify important details using primary sources.
Comments