
Allegiant Travel’s Strategic Merger and Operational Resilience Amid Leisure Travel Surge
Allegiant leverages its leisure travel focus and merger with Sun Country to bolster its competitive positioning, while improving margins in a challenging fiscal 2025.
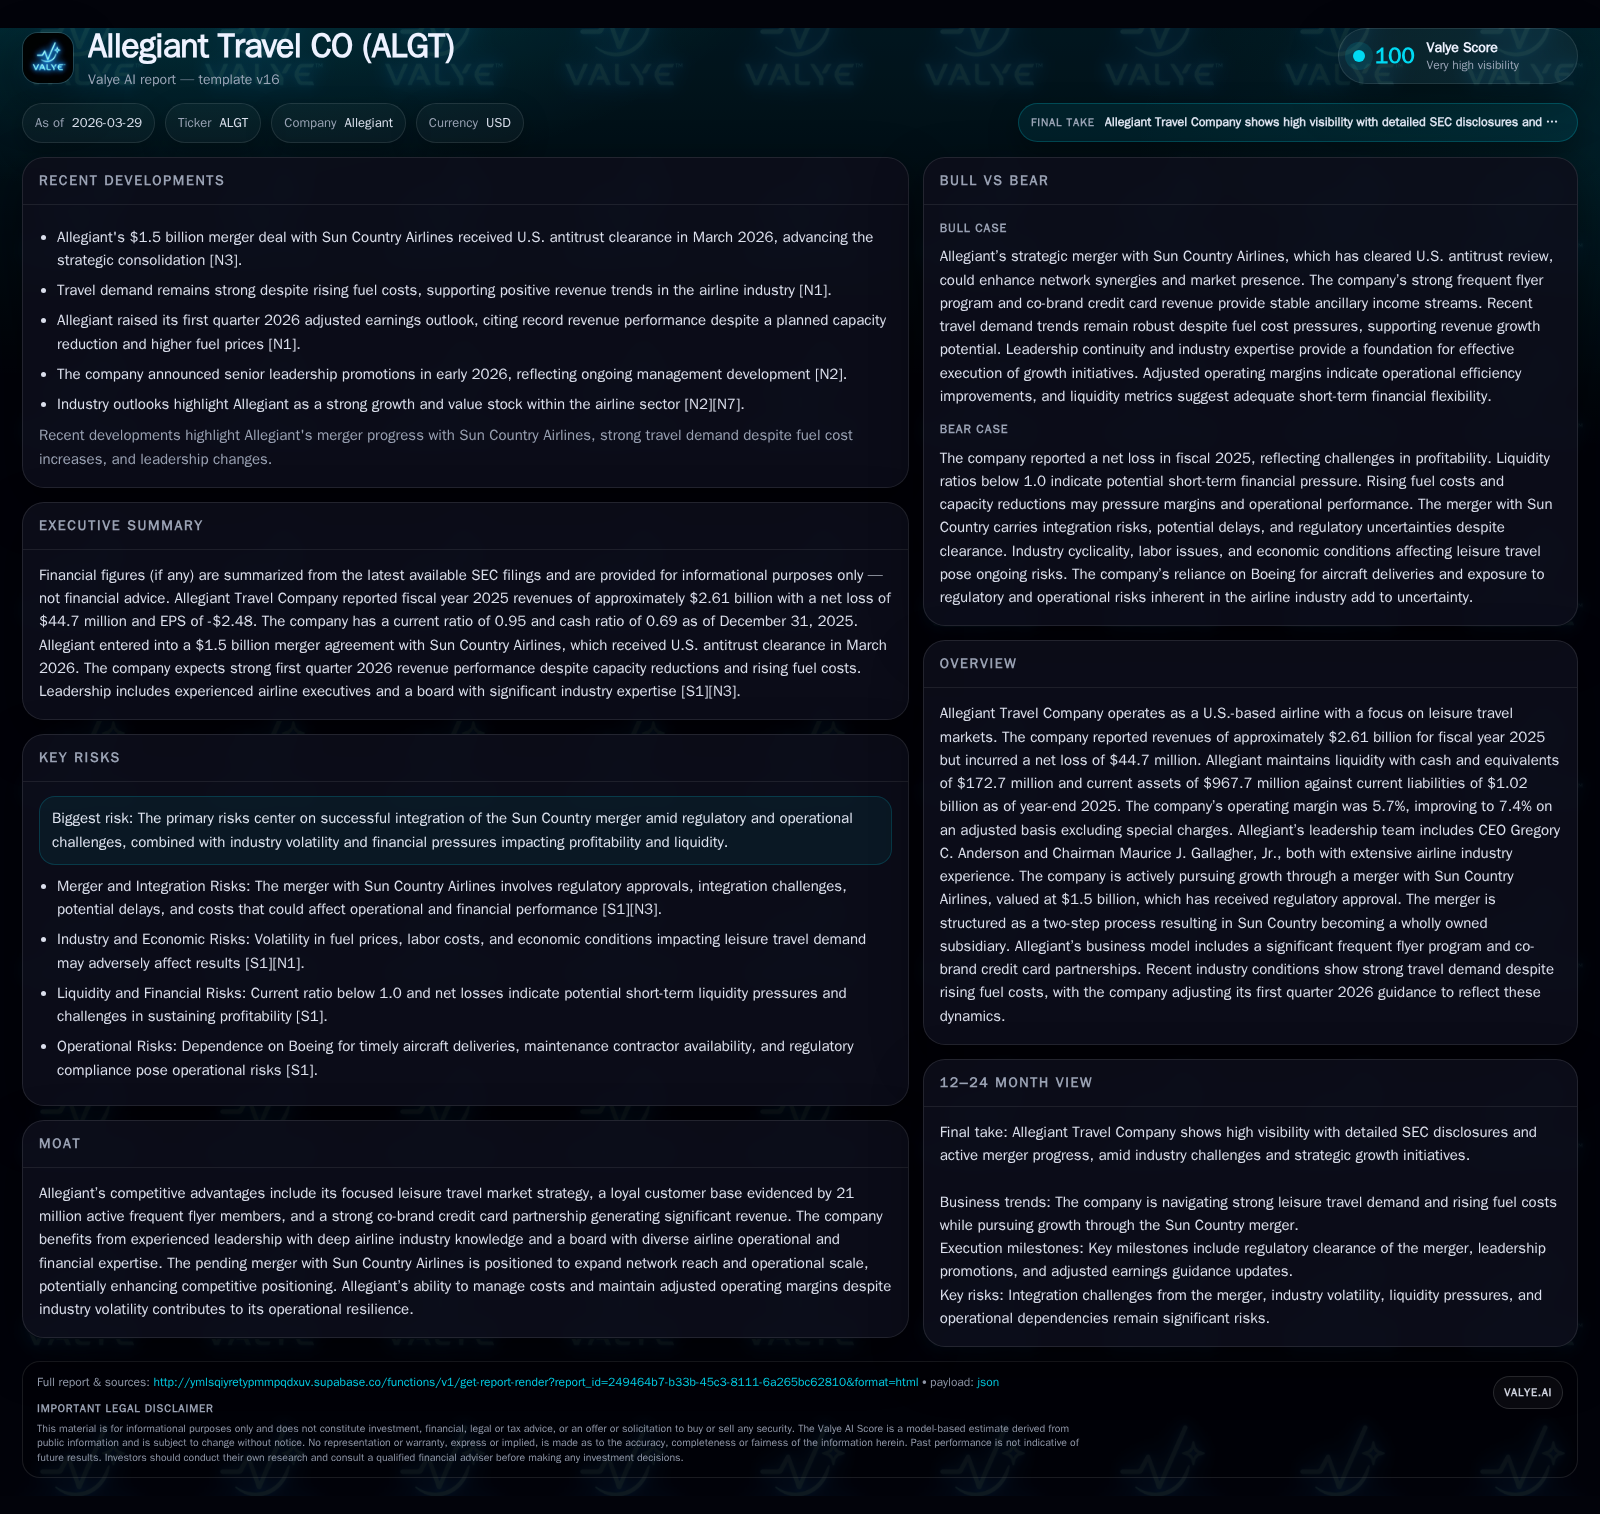
In fiscal year 2025, Allegiant Travel Company reported revenue growth and a recovering adjusted operating margin despite a net loss, signaling operational resilience supported by disciplined cost management. The company is actively pursuing scale advantages through its $1.5 billion merger with Sun Country Airlines, recently cleared by antitrust regulators, aimed at expanding its leisure travel network and enhancing competitive dynamics. While Allegiant benefits from a strong loyal customer base and lucrative ancillary revenue streams, the integration process, capital allocation decisions, and broader industry volatility present ongoing challenges to watch.
Rebounding Revenue and Margin Improvement: The 2025 Performance Snapshot
In fiscal year 2025, Allegiant Travel Company recorded revenues reaching approximately $2.61 billion, marking a 3.7% increase year-over-year [F1]. This growth follows a turnaround from a significant operating loss in the previous year. Operating income turned positive to $37.2 million from a negative $240 million in 2024, representing an over 115% improvement [F1]. Adjusted operating margin—excluding special charges—improved to 7.4%, reflecting enhanced cost discipline during challenging industry conditions [S13].
Despite these operational gains, Allegiant ended FY2025 with a net loss of approximately $44.7 million, an improvement over the previous year’s deeper loss but underscoring ongoing profitability pressures [F1]. Management attributes margin expansion partly to rigorous cost control during volatile fuel prices [S14].
Historical performance (annual)
| FY | Rev ($bn) | Net ($mm) | CFO ($mm) | OpInc ($mm) | Rev YoY | Net YoY |
|---|---|---|---|---|---|---|
| 2025 | 2.6 | -45 | 390 | 37 | +3.7% | +81.4% |
| 2024 | 2.5 | -240 | 338 | -240 | +0.1% | -304.3% |
| 2023 | 2.5 | 118 | 423 | 221 | ||
| 2021 | 2.3 | 2 | 303 | 92 |
Source: SEC companyfacts cache [F1].
Capital returns and efficiency (annual)
| FY | Div ($mm) | Buybacks ($mm) | FCF ($mm) |
|---|---|---|---|
| 2025 | 0 | 14 | 75 |
| 2024 | 22 | 6 | 38 |
| 2023 | 11 | 30 | -105 |
| 2021 | 0 | 30 | -132 |
Source: SEC companyfacts cache [F1].
*FY2021 data shown for broader context [F1].
Sun Country Merger: Expanding Route Network and Scale Benefits
A central strategic initiative for Allegiant is its planned acquisition of Sun Country Airlines for approximately $1.5 billion [N1], which received U.S. antitrust clearance in March [N1], [S5]. The deal aims to expand Allegiant’s leisure-focused route network and realize operational synergies through scale.
The combined airline expects to leverage complementary networks and customer bases—melding Allegiant’s loyal frequent flyer program with Sun Country’s routes—to enhance competitive positioning against other low-cost carriers through denser schedules and cost efficiencies.
However, SEC filings highlight risks including potential integration delays or higher-than-anticipated costs related to consolidating operations, IT systems, workforce cultures, and supplier arrangements [S6], [S7], [S9]. There is uncertainty regarding the timing and full realization of expected synergies.
Leisure Travel Niche and Loyal Customer Base as Growth Engines
Allegiant differentiates itself by focusing on leisure travelers in underserved markets rather than competing directly with legacy carriers on major business routes:
- Over 21 million active members participate in its Allways Rewards frequent flyer program [S15].
- Its co-brand credit card partnership generated nearly $140 million in remuneration during fiscal year 2025, providing significant ancillary revenue beyond ticket sales [S15].
- Leadership under CEO Gregory C. Anderson provides continuity amid sector volatility.
These factors contribute to stable cash generation potential critical for funding fleet renewal and network expansion.
Financial Snapshot: Operating Cash Flow, Capex Trends, and Liquidity Position
At the end of FY2025, Allegiant held approximately $172.7 million in cash and equivalents with current assets near $967.7 million against current liabilities of about $1.02 billion, resulting in a current ratio around 0.95 [F1].
Operating cash flow reached roughly $390 million during FY2025 supporting capital expenditures of about $315 million—primarily for fleet acquisitions—to sustain capacity growth ahead of merger integration needs [F1], [S8]. Free cash flow remained positive at approximately $75 million.
This cash generation supports working capital requirements and strategic initiatives while maintaining balance sheet flexibility ahead of substantial merger-related investments.
Capital Allocation Strategy: Dividends, Stock Buybacks, and Debt Management
Capital allocation reflects prudence amid evolving priorities such as merger costs and debt obligations:
- Dividend payments ceased in FY2025 after distributing approximately $21.9 million in Q3 FY2024, indicating focus on liquidity preservation during acquisition transition phases [F1], [S15].
- Share repurchases were modest at about $13.6 million in FY2025 compared with prior years’ higher levels, reflecting more cautious equity return amid earnings variability [F1], [S17].
- Amendments extended revolving credit facilities through late decade timelines while adding lenders, underscoring active debt profile management relative to Senior Secured Notes maturing mid-2027 [S11], [S19], [S24], [S27].
Overall capital deployment prioritizes financial stability enabling navigation of cyclical disruptions while preserving optionality for growth opportunities like the Sun Country deal.
Risks on the Horizon: Integration Challenges and Industry Volatility
Key risks include:
- Integration complexity may cause delays or elevated expenses due to operational consolidation challenges referenced extensively in filings [S6], [S12], [S27].
- Fuel price volatility remains a persistent risk; recent geopolitical tensions have pushed first-quarter fuel costs higher than prior guidance—from $2.60 to about $3.00 per gallon—pressuring margins despite resilient adjusted operating margin forecasts [S14], [N2], [N14].
- Regulatory approvals for international expansion remain pending; labor negotiations could increase wage costs further pressuring margins [S4], [S9].
- Macroeconomic fluctuations impacting discretionary leisure spending could affect demand given Allegiant’s market focus.
Mitigating these risks requires disciplined execution especially around merger integration coupled with financial prudence.
What to Watch: Key Milestones in Post-Merger Execution and Earnings Drivers
Investors should monitor:
- Integration progress including fleet harmonization, combined capacity metrics such as available seat miles (ASM), load factor trends reflecting synergy capture effectiveness post-merger announcement [N3], [S14], [S21].
- Adjusted earnings improvements will indicate success managing fuel cost headwinds.
- Credit rating developments post-closing influencing borrowing costs.
- Continuation of ancillary revenue strength like co-brand credit card performance supporting overall margins.
Tracking these indicators will clarify whether Allegiant can convert strategic initiatives into shareholder value amid external uncertainties.
Disclaimer: This analysis is based solely on publicly available information from SEC filings and news sources as of March 29, 2026. It does not constitute investment advice or recommendations.
Disclaimer: This is research-only, informational analysis and not investment advice. It may include AI-generated interpretation and general industry context. Always verify important details using primary sources.
Comments